

1
1 394
Simple and Profitable Strategy for Trading Breakouts
In the following article, I will describe a complete strategy for trading breakouts. This includes:
- Definition of “Breakout”
- Examples
- What Really Happens in a “Breakout”?
- Currencies to Trade
- Time Frames to Trade
- Sessions to Trade
- Find a Level for Possible Breakout
- Good Setup
- Trade Entry
- Stop-Loss and Take-Profit Levels
- Summary / Key Points
Many charts, with real setups and trade examples, are also included. These examples help explain the Breakout Trading Strategy and reinforce different points we’ll discuss. I hope you find this strategy helpful for your trading.
__________________________________________________________________________________________
► Definition of “Breakout”
“Breakout” is price movement through a barrier. The barrier can be a support or resistance level, a trend line, channel, triangle etc. Any technical level or price area, that holds price from moving higher or lower through it, is a barrier. The Breakout occurs when price finally moves through the barrier.
__________________________________________________________________________________________
► Examples
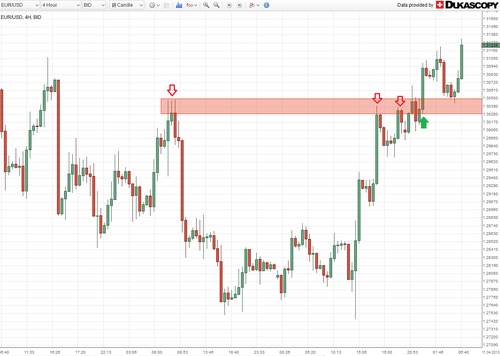
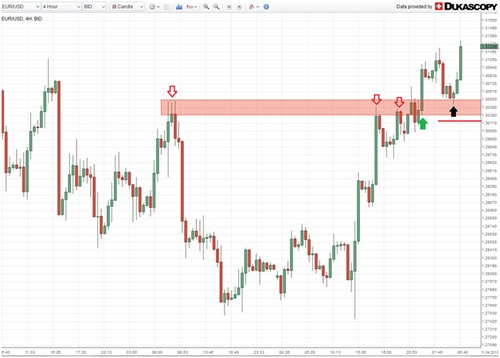
Let’s look at some recent examples. The first example is on EUR/USD 4 Hour Chart. The barrier lies in the area 1.3030-1.3050 (red rectangle). We can clearly see how this area acted as resistance, holding price several times from moving higher (red arrows). The Breakout is marked with a filled green arrow. Price broke through this barrier and continued to move higher.
The third chart is USD/CHF 1 Day. Here we actually see two breakout examples. The barrier is around 0.9380 (horizontal marked area). This area first acted as resistance (first two red arrows, from left). The first Breakout is marked with a filled green arrow. Price broke through on 28.02 and moved higher.
Then, the same 0.9380 area acted as support. It held price from going lower on 14.03 and 22.03 (green arrows). The second Breakout is marked with a filled red arrow. Price broke through on 04.04 and moved lower.

► What Really Happens in a Breakout?
Let's take for example a support barrier. When price first reaches the support barrier, it cannot move through it lower. The reason is that there are buyers at that level. They are buying the currency at the barrier price and support it from dropping lower. As long as the buyers have bigger positions and orders than sellers, they will restrain price from moving lower.
When Breakout occurs, the sellers have gained the upper hand. Their orders are bigger than the buyers' positions and orders. If sellers are much stronger than buyers, price will move swiftly through the support barrier. This is the Breakout. Price will trigger the buyers' stop losses. They are forced to cover their losses and liquidate their positions. In addition, usually new sellers will join and put in more sell orders. This will increase the selling pressure further and move the price even lower.
__________________________________________________________________________________________
► Currencies to Trade
The Breakout Trading Strategy works on all currencies. You can trade it on any currencies you want. I personally like to trade the Majors and some Crosses.
__________________________________________________________________________________________
► Time Frames to Trade
Best time frames for trading this strategy are the 1 Day and 4 Hour.
As seen in the examples above, the strategy works well on 1 Day and 4 Hour time frames. Barriers on these time frames usually hold firm at first tests. Finally, when price breaks through them, there is usually some significant continuation in the direction of the break.
On higher time frames, like 1 Week and 1 Month, barriers are even stronger. However, there are much fewer opportunities to trade in the same time span.
On the other hand, on lower time frames, like 1 Hour and 15 Minute, there are much more opportunities to trade. However, price will not respect barriers so well. There are many more false breakouts. Price will seem to break a barrier and then suddenly reverse back, without continuation in the direction of the break.
__________________________________________________________________________________________
► Sessions to Trade
Best sessions for trading this strategy are the London Session and the New York Session. There is usually good price movement at these times. We are interested in a significant price movement, after the breakout. So, it's just logical to trade at times that the market is very active.
__________________________________________________________________________________________
► Find a Level for Possible Breakout
The first step in implementing this strategy is finding a good level (=barrier) to watch for a possible breakout:
- On the 1 Day chart, the level should have held price for at least two weeks.
- On the 4 Hour chart, the level should have held price for at least 3 days.
- In both the 1 Day and 4 Hour time frames, the level should be tested at least three times before breakout.
- The longer a level holds and, even more importantly, the more it was tested - the better. The best breakouts happen after the barrier held many tests for a long period of time.
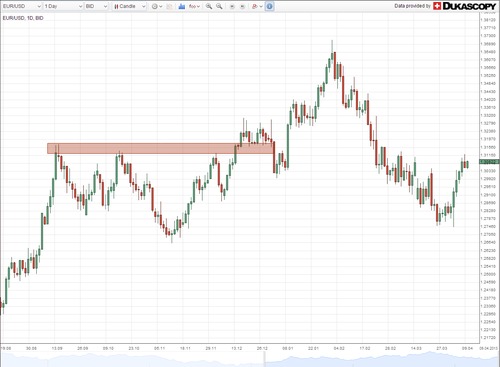
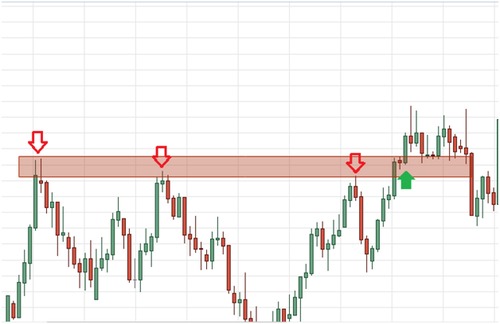
In the following EUR/USD 1 Day example, the level (red rectangle) is defined by three tests (red arrows) over a period of about two and a half months (red arrows during the period 13.09-1.12)
► Good Setup
A good setup has the following characteristics:
- The barrier held price for a long period (at least 2 weeks on the 1 Day or 3 days on 4 Hour - see above)
- The barrier was tested many times (at least 3 times - see above)
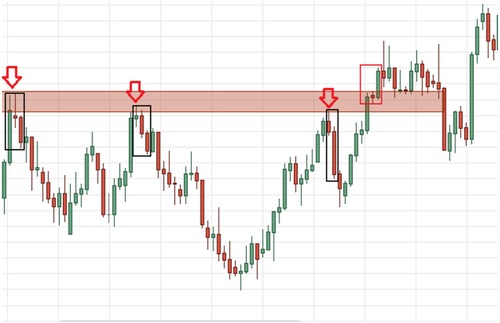
- Price moves swiftly to test the barrier for the final time before the Breakout. Here is a zoom-in of the previous example:
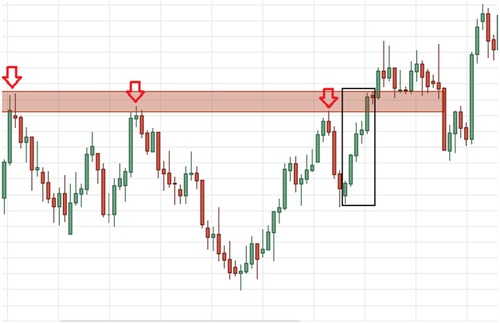
- Price isn't rejected at barrier level. It simply goes through it easily. For example, let's compare price action at the last test followed by Breakout (red rectangle) to that of previous tests (black rectangles). In the previous tests, price bounced back down. In the last test, price remains in the barrier area after the test, and then breaks out nicely.
- The Breakout Candle is a big, full bodied candle, or with a very small wick on the side of the break. This signals a powerful move, clearing all positions and orders that previously held the barrier (see "What Really Happens at Breakout?" above). Here it’s marked with a green arrow:
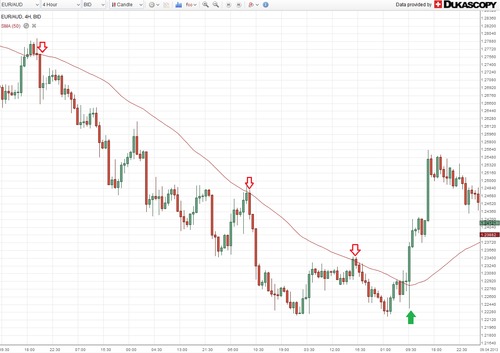
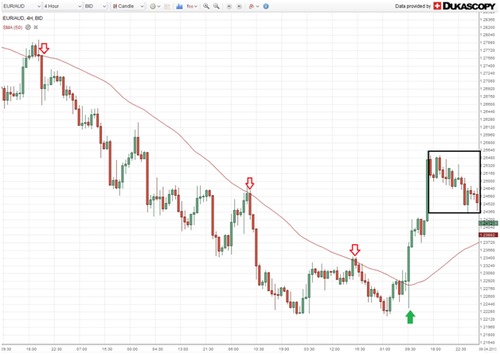
- Some more candles follow the Breakout Candle, in the same direction. We want to see some more continuation, as price gains momentum in the direction of the break. Here is a good example, on EUR/AUD 4 Hour. The continuation is marked with a rectangle:

- After price reaches some new barrier, it slides back to the breakout area. The candles of this pullback are much smaller than the Breakout Candle. There are more candles in the corrective pullback move, than on the impulsive Breakout move. The pullback move appears inside a black rectangle:
__________________________________________________________________________________________
► Trade Entry
Enter the trade when a pullback candle touches the Breakout level but does not violate it. For example, if the barrier was a resistance level, it should now act as support. So, the candle must close at the Breakout level, or above it. It must not close below it. Enter long, at the close of that candle.
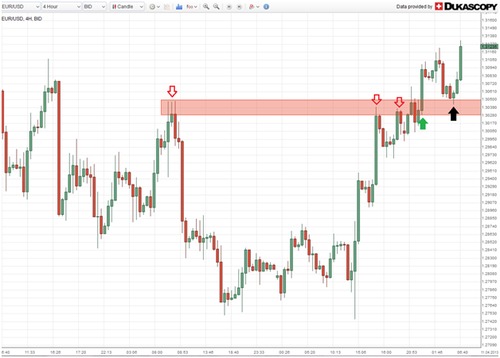
For example, in the following EUR/USD 4 Hour example, the trader buys at the close of the candle marked with a black arrow. The candle was the first candle to touch the Breakout area (red rectangle). It closed above that area, so it’s a good entry.
► Stop-Loss and Take-Profit Levels
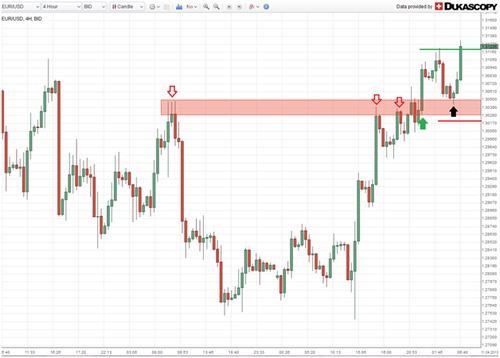
Stop Loss is placed 10 pips below the Breakout area, at 1.3020. It’s marked with a red line:
First Take Profit is the newest barrier. This is the area that price reached after the Breakout, before pulling back. In our example, it’s the recent high at 1.3120, marked with a green line:
__________________________________________________________________________________________
► Summary / Key Points
Here is a short Summary / Key Points of the Breakout Trading Strategy:
- Trading breakouts is a simple and very powerful strategy.
- Understanding the order flow at Breakout is important.
- Reading price action - before, during and after Breakout - helps us trade only good setups.
- Precise Entry, Stop-Loss and Take Profits levels maximize our profitability.


