

Top Trading Opportunities for 2017 - Part II
Indecision ruled much of 2016 – as it had the year before. Global equities and the Dollar carved out broad ranges rather than extend the trends of previous years. That complacency was shaken however in the final quarter of the year. A buildup of major event risk from Brexit to the US Presidential election to the second Fed rate hike put markets back in motion. Will revived trends hold true into the New Year or is volatility the only holdover to depend on? These are the DailyFX Team’s top trade opportunities for 2017.
Top Trades:
- John Kicklighter, Chief Strategist: GBP/JPY Combines a Depressed Pound and Risk Trends
- David Song, Currency Analyst: Tracking Key Market Themes Beyond Monetary Policy
- Jeremy Wagner, Head Trading Instructor: A Typically Quiet EUR/GBP May Provide an Outsized Move
- Paul Robinson, Currency Analyst: NZDUSD, Gold/Silver Setting Up for More Losses Before Hitting a Low
- Jamie Saettele, CMT, Senior Technical Strategist: Cyclical USDZAR Downswing May Be at Hand
- Tyler Yell, CMT, Forex Trading Instructor: Awaiting Aggressive Bullish Bounce In Gold From Higher-Low
- Walker England, Forex Trading Instructor: Finding Potential Trading Opportunities in EUR/GBP
- Martin Essex, Market Analyst and Editor: EUR/JPY Faces Rising European Troubles, Brighter Japanese Horizons
- Michael Boutros, Currency Strategist: AUDJPY | Breakout at Initial Resistance- Constructive Above 80.60
- David Cottle, Market Analyst: What if the Fed has Under-Gunned its Rate Hike Call?
- James Stanley, Currency Analyst: Long EUR/AUD – Buy Support, Sell Resistance
- Oliver Morrison, Market Analyst: British Pound Set for Further Gains on Japan’s Yen
- Nick Cawley, Market Analyst: GBP Recovery Against EUR Likely on the Cards in 2017
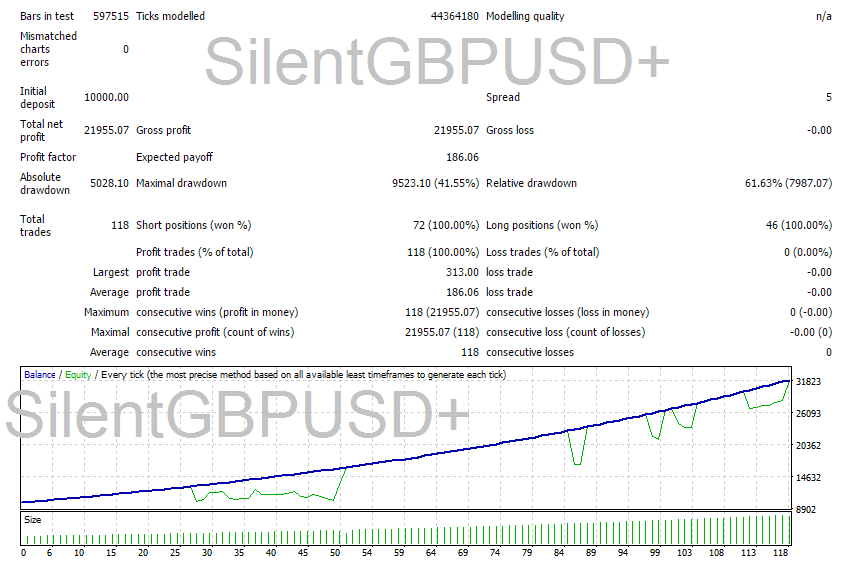
AUD/JPY Weekly
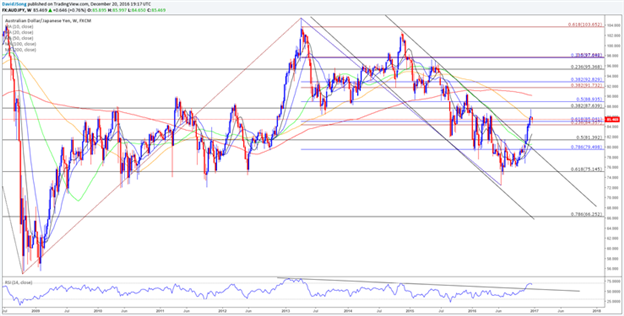
The rise in risk appetite also appears to have sparked carry-trade interest, with AUD/JPY highlighting a material shift in market behavior as it breaks out of the downward trending channel carried over from late-2014. A similar reference can be found in the Relative Strength Index (RSI) as the oscillator flashes a bullish trigger ahead of 2017. The key developments favor opportunities to buy-dips in the Aussie-Yen, and the Reserve Bank of Australia’s (RBA) policy meetings for the year ahead may further boost the appeal of the higher-yielding currency should the central bank show a greater willingness to gradually move away from its easing-cycle.
After cutting the official cash rate to a fresh record-low of 1.50% in August, the central bank now under Governor Philip Lowe looks poised to retain the current stance over the coming months as officials see inflation ‘returning to more normal levels’ over the policy horizon. Despite concerns surrounding the region’s AAA-credit rating, the RBA may adopt a more hawkish tone in 2017 as ‘globally, the outlook for inflation is more balanced than it has been for some time,’ and the diverging path for monetary policy may fuel greater interest in AUD/JPY should Governor Lowe continue to talk down speculation for lower borrowing-costs.
With that said, key themes beyond monetary policy may play a greater role in driving volatility across the financial markets, and the shift in market behavior instills a bullish outlook for the Nikkei 225 and the AUD/JPY exchange rate as the reach for yield looks to persist in 2017.
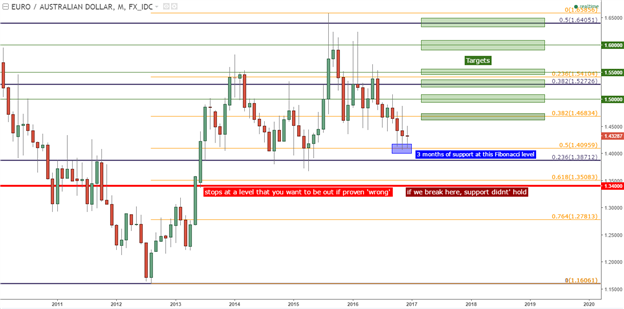
Long EUR/AUD – Buy Support, Sell Resistance
Trying to forecast a year in advance, especially from a macro-economic point-of-view, can be difficult and perhaps even disastrous. If you’d have said last year that 2016 would see both the U.K. deciding to leave Europe after the Brexit referendum, and the election of Donald Trump to the top-post in the United States, you’d probably be pretty hard-pressed to find anyone that actually believed you.
Next year could be equally or, perhaps even more volatile than 2016; especially for Europe as we head towards election cycles in the key regions of France and Germany. Combine this with continued-crisis in the banking sector of Italy, and there are some very big question marks for Europe next year.
But what we do know is that the ECB is effectively tapering QE by reducing purchases after March; and the bank may not have enough ammunition to do another round. Also of interest is the fact that the Euro has had a difficult time heading lower as we approach the widely-watched parity figure on the U.S. Dollar. When the ECB first announced QE in July of 2014, EUR/USD drove all the way down to 1.0462. But after QE actually began in March of 2015, EUR/USD remained supported above this prior-low. It wasn’t until the Federal Reserve ramped-up hawkishness for 2017 that EUR/USD finally broke-below that support.
But not many currencies are as strong as the U.S. Dollar with the post-Election back-drop. Rather than looking to buy support on the Euro against the U.S. Dollar, which could foreseeably continue to strengthen for months ahead; long-Euro setups could be directed towards the Australian Dollar. Australia still has some room to cut rates, a new Central Bank head in Phillip Lowe, and the potential for more-pressure (or weakness) to emanate from China.
But what makes the long setup attractive is the risk-reward on the monthly chart. After setting a fresh-high in August of last year at 1.6586, the pair has spent much of the time since in some form of congestion. The past three months have seen support show up at the 50% Fibonacci retracement of the most recent major move, taking the August 2012 low to that August 2015-high.
Stops on the position can be set to 1.3400, which would get the level below the 61.8% retracement of that most recent major move. Top-side targets could be sought at 1.4683 (to adjust stop to break-even), 1.5000 (major psychological level), 1.5273 (long-term Fibonacci level), 1.5500 (prior price action swing), 1.6000 (major psychological level) and 1.6405 (another long-term Fibonacci level + near 8-year high).
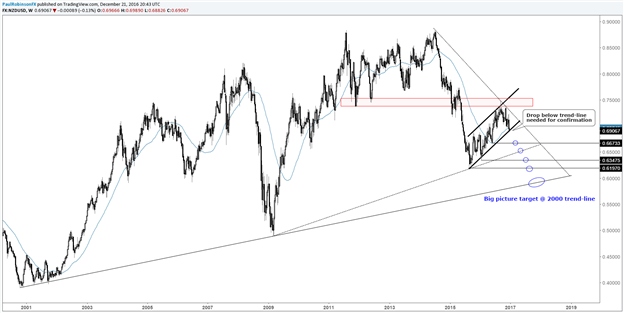
NZDUSD, potential for a return to the long-term trend-line
NZDUSD was not kind to big picture bears during most of 2016, but there is reason to believe this could change in 2017 as momentum from the swoon in Q4 may be the beginning of a big leg lower. The low created in August 2015 took Kiwi higher for longer than many expected. Many market participants, self-included, were looking for the downtrend which began in 2014 to resume at an earlier time.
The upward grind in Kiwi from the 2015 low morphed into a defined channel, or bear-flag in this case. After being rejected near 7500 it’s currently testing the bottom-side parallel of the pattern. An official break of the formation will be considered with a strong closing weekly bar beneath the lower trend-line.
There are several targeted points of support along the way towards the big picture target. Levels to watch include the May ’16 low at 6673, trend-line from the 2009 low (~6475/6550), Jan ’16 low at 6348, the Aug ’15 low at 6197, then the final target arrives at the 2000 – current trend-line. The trend-line clocks in around 5900 (+/- 50 points), or about 15% lower from here.
Trading this theme: This is highly dependent on the time-frame which one operates on, but the idea on this end is to wait for a confirmed break and then look to retracements on the daily chart. Once broken, the rising trend-line will go from being viewed as support to resistance. In addition, interest will be taken in any attempts to trade up to the downtrend line off the 2014 high. It seems unlikely if the bearish view is correct it will trade that high, but if Kiwi does it won’t undermine the outlook until it can successfully trade above the trend-line.
NZDUSD: Weekly
Gold & silver look headed lower, but important support levels hold the key
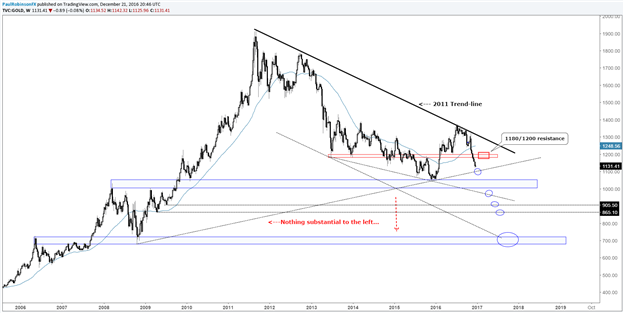
Gold looks poised to continue disappointing investors. The trend since the 2011 peak remains lower and should key levels on the downside fail to hold, gold could find itself continue winding lower in rapid fashion. There is significant support in the 1050/00 region. If this zone is broken, then watch for momentum to accelerate. Before the big region is tested, though, there is a trend-line of minor significance which could be enough to provide a bounce; it rises up from the 2008 low to around the 1100 mark. Below that trend-line and through 1000 there isn’t anything substantial in the way of price support until down to around 730/680 (2006 high/2008 low). That’s an aggressive move, but again, given the lack of major price support it could become a reality. Other levels below 1000 arrive at the bottom-side trend-line running lower from the 2013 low (~975/60), along with pivots from 2009 at 905 and 865.
Trading this theme: In Q4, gold broke the key 1180/1200 region extending back to 2013. A rally into that zone (perhaps from the 2008 trend-line) will be viewed as a point of interest to look for weakness to set in and potentially position for a move into the important 1050/00 support zone, or worse. If gold drops into the 1050/00 area, caution will be warranted from the short-side given its significance. This is the line-in-the sand for gold bulls. Hold, then a sizable rally may develop, but if it breaks then things might get ugly. It just may be what the bear market needs to end, a final flush after several years of carrying lower.
Gold: Weekly
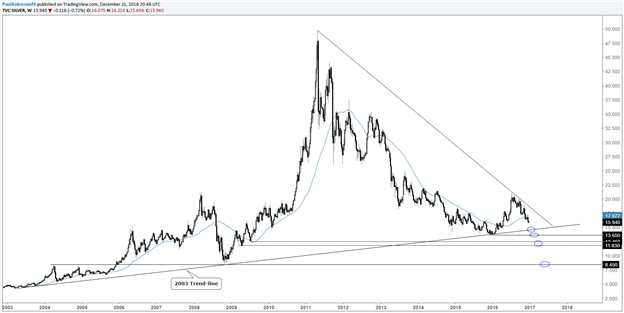
Silver is obviously setting up similarly to gold, but with its own twist. Silver is currently heading back to a trend-line in place since 2003, which will be a very important inflection point. The level is currently around 14.50. A break below there will clear a path to the late-2015 low at 13.65. Similar levels to gold should it fall below the 2015 low are 12.46, 11.83, then nothing significant to the left until 8.45. The long-term trend-line looks likely to be met soon, and whether it can hold there or at the 2015 low could hold significant long-term implications.
Silver: Weekly
Kiwi and precious metals are highly correlated, worth noting for positioning purposes
The 52-week correlation between Kiwi and gold/silver is 70% and 86%, respectively. The long-term correlation between Kiwi and precious metals has been statistically significant, with the past two years sporting a range between 42% and 90%. If positioning on the same side in NZD and precious metals, traders will want to be aware of this correlation for risk management purposes. Keep in mind, this is a long-term correlation and the shorter the time-frame you look at the more noise there is in the correlation.
Walker England, Forex Trading Instructor:
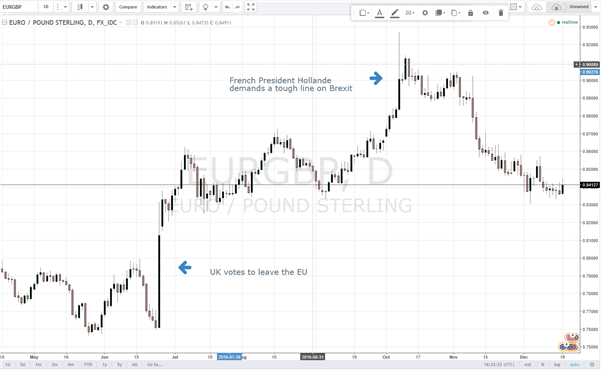
Finding Potential Trading Opportunities in EURGBP
2016 held more than a few twists and turns in the market for traders. This is why it is always important to keep an eye on emerging and ongoing technical trends. Ultimately finding the trend will help make our decisions to buy and sell easier, but it can also help us know which pairs to target for the upcoming 2017 trading year. Currently the EUR/GBP is working on retracing much of its 2016 gains after testing a multi-year 78.6% retracement value.
My preference is to find opportunities to sell the EUR/GBP under the standing 200 day moving average (MVA) which is currently found at .8305. This value is currently acting as technical price support for the pair, which suggest that traders may look for a breakout below this point. Not only would this be a strong technical hint that the trend is again turning bearish, but it would also potentially classify the 2016 move to .9270 as a lower high in a much broader bearish pattern.
EUR/GBP Daily Chart & Retracement Values
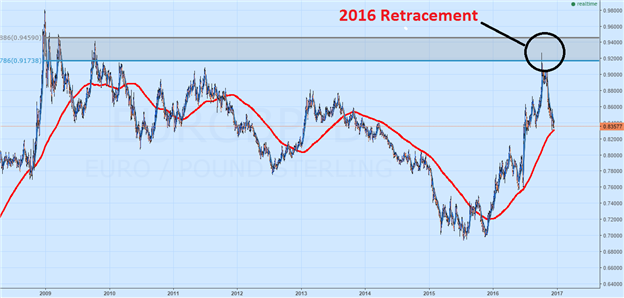
As with any trade idea, there are always two sides to each story. Traders should remember that there is always the possibility that the EUR/GBP may remain supported for the 2017 trading year. In this scenario, traders may choose to delete any existing entry orders to sell the EUR/GBP. If prices do increase, traders may look for the pair to make a move on the previous 2016 high at .9270. A move above this value would suggest that the pair is attempting to put in higher highs and may attempt a move on the multiyear 2009 high of .9804.
EUR/JPY Faces Rising European Troubles, Brighter Japanese Horizons
The coming year looks likely to be an annus horribilis for the Euro. The Italian banking system remains in crisis and there are national elections in Germany, France, the Netherlands and perhaps Italy – all events that could spark Euro weakness.
Add in record lows for two-year German bond yields – the benchmark for the Euro-Zone – plus the potential for difficult negotiations between the EU and the UK over Brexit, and it’s hard to see much support for the single currency in the months to come.
While the obvious trade against this background would be to short the Euro against the US Dollar, the problem with that is the markets’ skepticism that the Federal Open Market Committee (FOMC) will deliver the three US quarter-point interest-rate increases in 2017 that it predicted in December when it raised its benchmark Fed Funds rate by 25 basis points (a quarter of a percentage point) to a range of 0.50% to 0.75%, implying a year-end rate range of 1.25% to 1.50%.
Instead, the CME Group FedWatch tool, which is based on CME Group 30-Day Fed Funds futures prices, which have long been used to express the markets’ views on the likelihood of changes in US monetary policy, shows the most likely range by December 2017 at 1.00% to 1.25%.
That, in turn, suggests a lack of interest-rate support for the Dollar and potential currency weakness, particularly if nervousness grows about the economic policies of US President-Elect Donald Trump.
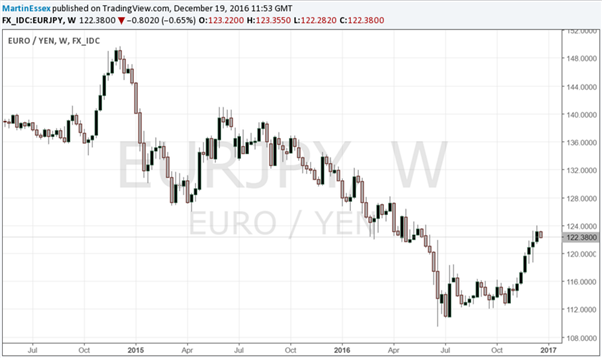
By contrast, the Japanese Yen has plenty going for it. For a start, it is seen by some as a haven– along with gold and US Treasuries – to shelter in when markets are risk-averse, as they are likely to be in 2017. Moreover, recent Japanese economic indicators have been healthy and core inflation may have bottomed out. In addition, EURJPY has been climbing for the past six months, suggesting room for a correction.
Chart: EURJPY 1-Week (June 2014 - December 2016)
While any tightening of Japanese monetary policy is not on the cards, it’s notable that net speculative short Yen positions have reached their highest level since December 2015, according to data compiled by the US Commodity Futures Trading Commission. Any short covering would likely boost the Japanese currency.
On the other side of the coin, there’s plenty of political event risk ahead for the Euro. For a start, there’s the Brexit negotiations, which will likely start at the end of March and could be long and tortuous.
Then there are the elections: in the Netherlands on March 15, followed by France in April and May, and then Germany between August and October. In all three, far-Right – and largely Euro-skeptic – politicians will mount serious challenges to the incumbents. In Italy, too, there could be an election in 2017 in another country where populism is on the rise and, in addition, the banks are said to be saddled with more than €350 billion of bad loans.
That said, there is plenty of support for EURJPY around the August/September 2016 lows of 112.04/24 and then at the July 2016 lows close to 110.94. Both those areas would have to be breached before any slide back to the 100.00 levels last seen back in 2012. On the upside, any break above the 140.50 highs reached in June 2015 could lead to a sharpish rise back up to the levels around 150.00 recorded in December 2014.
What if the Fed has Under-Gunned its Rate Hike Call?
Think back to the end of December, 2015. The US Federal Reserve had just raised interest rates for the first time in nearly a decade. The post-crisis Fed Funds rate of 0.0-0.25% was finally history. And, the Fed expected to make four more increases through 2016. The markets never quite believed that. Sure enough, they were right.
For four rate hikes, read just one.
Here we are at the end of 2016. The Fed has just raised rates again. It expects to be doing the same, thrice, through 2017. And guess what? Markets don’t quite believe it. Futures contracts suggest only two hikes. However…It’s worth pointing out that rate-hike cycles can last longer than anyone thinks. Nobody has seen one since 2004; experts with experience will be a lot rarer.
To take an obvious example we might go back to 1973. Then there was a generally weaker US Dollar. Wage and pricing controls boosted inflation, and it took some fighting. Between March 1972 and October 1973 rates went up from just over 3% to more than 10%. Almost every hiking cycle since 1965 has involved more substantive increases than those currently envisaged by the Fed.
“Aha,” you may now say. “But we live in a low-inflation world, we won’t need the same magnitude of interest rate rises to bring inflation expectations into line.” Good point. But history suggests inflation can be harder to control than it seems. We’ve also had massive, inflationary fiscal stimulus, and rises for previously docile oil prices. We’re also less sure about monetary transmission - the way central bank decisions affect economies.
Ultra-low rates and money printing haven’t bought the growth they were once thought capable of. Might raising rates also fail as inflation brake? Then there is President-elect Trump. If his campaign rhetoric is to be believed, we can expect a deliberately inflationary fiscal policy. Coming when US employment is already relatively high, it’s not hard to see such a program pushing up wages, and then prices.
In short, the backdrop could be more inflationary than it has been for years. In that case, it makes sense to be long of the US Dollar and to remain long. It is probably best to express this via currency pairs for which rate rises on the “non-dollar” side are less likely, like the Euro or the British Pound. Gold would come in for even more severe punishment than that already meted out. US Treasury yields would also have to rise much further too.
There are clear risks to this scenario. Trump may be less expansionary once in power. European Union worries may presage crisis. China’s return to form may falter.But if all these can be avoided, we may find that we get higher US rates than the Fed now expects.
British Pound Set for Further Gains on Japan’s Yen
In a nutshell:A weak Yen and resilient UK economy will likely result in a stronger GBPJPY. GBPJPY is up around 14% since the start of November, and looks set to continue making gains in 2017.
Background: The Yen is weak, which is exactly where the Bank of Japan wants it. And little looks to be changing that. On December 19, the BoJ kept monetary policy steady, leaving rates at minus 0.1%, a decision that weakened the Yen against its peers.
The BoJ did raise its assessment of the economy for the first time in a year, noting the economy is continuing its moderate pace of recovery. But the Bank still has low inflation expectations. Inflation remains near zero, almost four years after the BoJ began enormous monetary stimulus.
This suggests the Bank is unlikely to change its easing policy next year, which will keep the Yen weak. Most economists surveyed by Bloomberg don’t expect any additional easing before Governor Haruhiko Kuroda steps down in 2018.
The UK economy, meanwhile, keeps showing remarkable resilience after the shock vote to leave the European Union in June. The Pound crashed to record lows in the aftermath of the referendum. But it’s staged a modest recovery against a host of currencies in recent weeks.
GBPJPY dipped 16.6% the day after the Brexit vote, but has slowly crept back to pre-referendum levels as the risks of a ‘hard’ Brexit recede. Bearish bets against the Pound dropped for a second week on December 13, according to the US Commodity Futures Trading Commission. If the Brexit process is “orderly and smooth”, as Prime Minister Theresa May promises, the Pound will gain more strength.
What are the key levels?GBPJPY has been rising since the start of November. There is huge support around the 127.00 level from October’s trading range. Resistance is at 152.50-163.50, which is the pre-UK referendum high achieved in February to May 2016. If these levels are breached, the next key zone is the 195-191 range hit between June and August 2015.
Risks to this trade:
- Inflation catches alight in Japan and heads towards the BoJ’s 2% target, leading to a shift in policy from the Bank.
- Brexit risks finally appear in UK data prints, forcing interest rates, and the Pound, down as the Bank of England moves to avoid recession. Any indications the UK is heading towards a ‘hard’ not ‘soft’ Brexit will weigh on the currency.
- GBPJPY is traditionally volatile. Net speculative short Yen positions have reached their highest level since December 2015, according to the US Commodity Futures Trading Commission. Any short covering would likely boost the Japanese currency, but hopefully, if you’re long GBPJPY, only in the short term.
GBP Recovery Against EUR Likely on the Cards in 2017
It has been a tough year for the British Pound with the June referendum vote for the UK to leave the European Union causing sterling to slump overnight in excess of 15% against the single currency. EURGBP jumped from a pre-Brexit level around 0.7600 to a spike high around 0.9200 and led to many commentators calling for the pair to trade at parity within a short-time frame. The British Pound also sold off sharply against the US Dollar as investors shunned the UK ahead of the start of the country’s formal divorce proceedings from Europe, expected by the end of March 2017.
While sterling has remained at the lower levels against the US Dollar, prompted in part by the Federal Reserve’s decision to hike rates and the likelihood of another three increases in 2017, the UK currency has pulled back some of its losses against the single currency as the weak economic backdrop in the EU continues to weigh on the currency. And the growing tide of discontent across Europe will do little to help the current situation as Europe faces four – Netherlands, Italy, France and Germany - potentially tricky general elections in 2017. Any shifts towards anti-EU parties and the future of the single currency will come under intense scrutiny.
In the fixed income market, the yield differential between the UK and Europe has also increased in the last few months, aiding GBP. The 2-year UK gilt currently yields around 0.12% compared to -0.785% for the 2-year German equivalent and this gap is likely to grow as UK inflation expectations continue to increase. The Bank of England recently highlighted that consumer price inflation is likely to hit 2.8% in 2017, from an estimated 1.3% this year, as the effects of weaker sterling filter through. This is above the BoE’s target of close to 2% and will not be tolerated for long by Governor Mark Carney. In contrast the latest ECB forecasts see inflation hitting 1.3% next year, still way below the central bank’s target of close to 2%. The ECB recently trimmed down and extended its bond buying program until the end of next year at least, hinting that the central bank is still concerned over the lack of price pressures in the economy.
When the UK triggers Brexit, by the end of next March by the latest, the endless rounds of rumours and ‘what-if’ articles over the UK/EU break-up will shift to a more factual basis. And it is here that any movement towards a ‘soft-Brexit’ - the most likely stance - will give sterling an additional upward boost as both sides realise that flexibility needs to be shown between two of the largest global economies. Neither side will benefit from a prolonged ‘hard-Brexit’ especially in Europe where growth is still anaemic, while the UK will suffer badly if the financial services industry is forced to move out of London due to a lack of access to European markets.
Will the Euro give back more of its Brexit gains?


")