US DOLLAR Technical Analysis: Understanding 3M LIBOR’s 7-Yr High

US DOLLAR Technical Analysis: Understanding 3M LIBOR’s 7-Yr High
Talking Points:
- US Dollar Technical Strategy: Another Test at Key Resistance Deserves Our Attention
- 3M USD LIBOR 7-Year Highs May Be Indicative Of Increasing USD Strength
- Blackout Period For Fed Ahead of September 21 FOMC Likely Pushes Up Volatility

The US Dollar has had a very volatile September. After a highly anticipated NFP that was disappointing on the headline, many had discounted action by the Federal Reserve, and the US Dollar sold off. However, institutions are not sure that’s the best play for the US Dollar, and a few funding markets are showing this to be the case as well.
Many banks are looking at the US Dollar as one of the more undervalued currencies in the G8 because of the market, as per the UST 2YR Yield is only pricing in one and a half rate hikes through 2018. Naturally, this is in contrast with the rather optimistic Federal Reserve Vice President Stanley Fisher who noted that two were possible in 2016. The Federal Reserve is now in Blackout-Mode so external markets like Fixed Income may drive USD in the short-term.
One key development that is warranting a lot of attention away from the spot-FX market is the sharp increase in 3M USD London Interbank Offered Rate or LIBOR. Looking at the chart above, you can see the sharp rise that has taken place over the past year. The LIBOR rate is taken daily from a set of banks with the outliers canceled. The rate is used to set the unsecured borrowing costs in the London Interbank Market over different periods, and a spread is typically added to create the borrowing rate for short-term borrowing that is common in capital and money (short-term) markets.
5-Year USD 3M LIBOR Chart [USD Interbank Funding Costs]
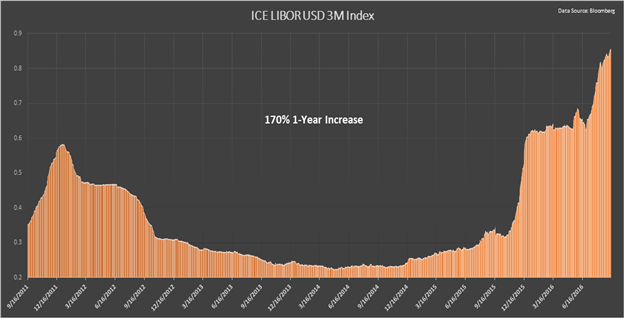
The increase or slope is predicted by JPMorgan to end the year at ~0.95bps, which would be another ~11% rise. Many perceive this to be important because it indicates that the lending market may be tightening up ahead of the fall season of FOMC meetings where the Federal Reserve is expected to raise rates. Such an increase may give the Federal Reserve the open door needed to hike, and this could bring the US Dollar through the key resistance of ~12,000/100 that we’ve been watching for so long.
However, if the LIBOR continues to rise, that could mean that the Fed does not need to hike to have a stronger US Dollar, which is something many hedge fund managers have been waiting on for a while now.
D1 USDOLLAR Index Chart / Sharp Reversal Appears Able To Surmount Resistance
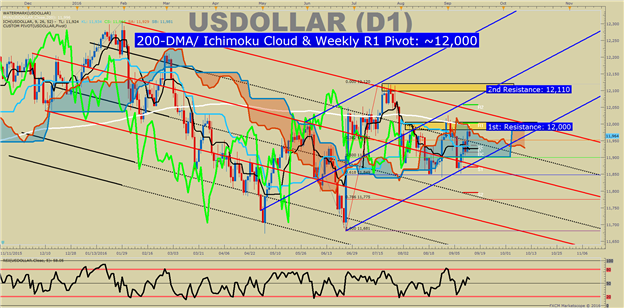
The US Dollar index has come back to the first key resistance level mentioned in recent posts at 12,000. One bearish development we pointed out is that the 8/30-9/1 price action looks like a clean evening star pattern. The internal doji high is 12,027, which can also be seen as internal resistance. A break above 12,027 in the coming days would turn attention to the last level of key resistance at 12,114. If the lower parallel line (blue) fails to hold, we won’t hold our breath for either resistance level to get triggered. However, if the price remains above the lower parallel line, we could see a steady move towards 12,114 where the Bullish Pitchfork median line lies.
You’ll also not that the Ichimoku Cloud aligns with the pitchfork, which could be showing that support is building up above the US Dollar. Strong support for the US Dollar, for now, appears at 11,849, which is the 61.8% Fibonacci Retracement of the pre-Brexit to July high in the US Dollar in addition to the Andrew’s Pitchfork and Ichimoku Cloud floor. Should a break below 11,849 emerge, we will default to continue using the Bearish Pitchfork as a frame to anticipate price action.
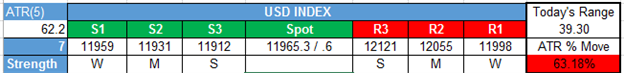
Shorter-Term US Dollar Technical Levels for Wednesday, September 14, 2016