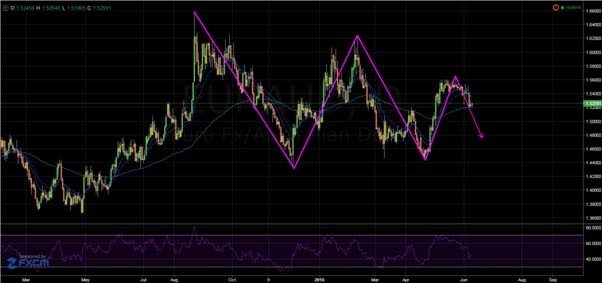
The EURAUD’s Corrective Triangle Entering Final Leg
The EURAUD has been making some rather large movements as of late and it could be about to complete a pattern which began in September last year. Moreover, technical indicators are signalling that the final leg of a corrective triangle pattern is potentially about to kick off strongly. Consequently, there remains some significant downside potential for the pair and it could be worth watching closely.
A rather large corrective triangle pattern has formed over the past few months which signals two things. Primarily, it makes it highly likely that this pair is poised to continue trending downwards in the immediate future. Specifically, the EURAUD should tumble until support is found around the 1.4695 level as has been the case previously. Secondly, once support has been found around this level, a subsequent rally will likely occur which is worth taking into account.

Also hinting that the pair is set to tumble is both the recent EMA activity and the Parabolic SAR indicator. Looking at the daily chart, it's clear that a potential crossover of the 12 and 20 day EMA's is imminent. As a result, the recent bearishness of the pair could extend and see the 1.4695 support tested. However, the 100 day EMA could provide some strong dynamic support which could limit the EURAUD's ability to break the current support.
As for the Parabolic SAR readings, this indicator has been signalling that selling pressure is increasing significantly. Currently above the candlesticks, the indicator is hinting that there remains downside potential for the pair. Moreover, a neutral RSI oscillator is in agreement and shows that there could still be room for the EURAUD to slide lower.
Looking to the H1 and H4 charts, the EMA and Parabolic SAR trends emerge once again which could mean that the downturn has already begun. Specifically, the 12, 20, and 100 period EMA's are all highly bearish on both of the shorter time frame charts. Additionally, the Parabolic SAR reading remains bearish on the H4 chart but it is turning bullish on the H1.
Ultimately, this triangle pattern has been a long time forming but it could soon be coming to an end. Specifically, keep a close eye on EMA activity, Parabolic SAR, and the RSI oscillator as they are not only key in detecting where the final leg begins, but also where it completes. Furthermore, stronger commodity prices are worth keeping watch for as they could send the pair plunging to support if they rally the AUD.


