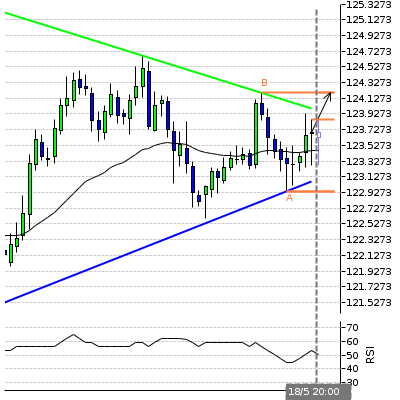
Triangle identified at 18-May-20:00 2016 GMT. This pattern is still in the process of forming. Possible bullish price movement towards the resistance 124.2 within the next 3 days.
Supporting Indicators :
Upward sloping Moving Average
Resistance Levels :
( B ) 124.2Last resistance turning point of
Support Levels
( A ) 122.94Last support turning point of Triangle.