
GBP/USD: Sterling Rallied to a Fresh 3-Week High Against the Greenback

GBP/USD: Sterling Rallied to a Fresh 3-Week High Against the Greenback
EUR/USD
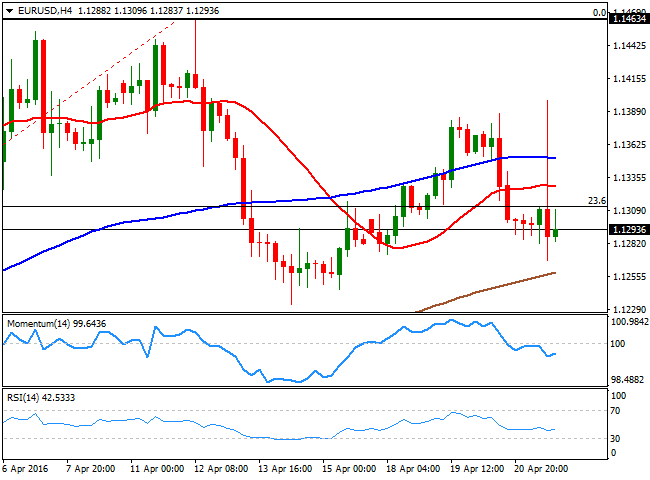
The main market focus and driver this Thursday, was the ECB and its economic policy meeting, and as expected, the European Central Bank did not announce any new measures, centering on the implementation of the batch of policies announced last month. The American dollar turned south ahead of the event, and the EUR/USD pair spiked during the press conference up to 1.1398, in where ECB's President, Mario Draghi, reckoned that the downward risk towards inflation persist, and that it may fall back into negative territory during the upcoming months, before picking up by the end of the year. The generally dovish tone of the press conference, and the failure of the common currency to regain the critical 1.1400 level, finally resulted in an uturn of the greenback, which soared across the board as Draghi kept the door open for additional easing in the future.EUR saw its gains rapidly eroded after market's attention shifted towards the upcoming FED meeting next week, as somehow, market expects a hawkish statement, preannouncing a June rate hike. The EUR/USD pair ended back where it started, below the 1.1300 level and the 23.6% retracement of the latest daily bullish run at 1.1315. The long upper wick of the daily candle suggests that bulls are in retreat mode, implying the pair can fall further during the upcoming days. From a technical point of view, the pair presents a neutraltobearish stance, as in the 4 hours chart, the price is below a horizontal 20 SMA, whilst the technical indicators head nowhere within negative territory. The pair needs to break, either below 1.1220, the 38.2% retracement of the mentioned rally, or above 1.1460, a major static resistance, to be able to find a clear directional path.
Support levels: 1.1270 1.1220 1.1160
Resistance levels: 1.1315 1.1340 1.1390
GBP/USD
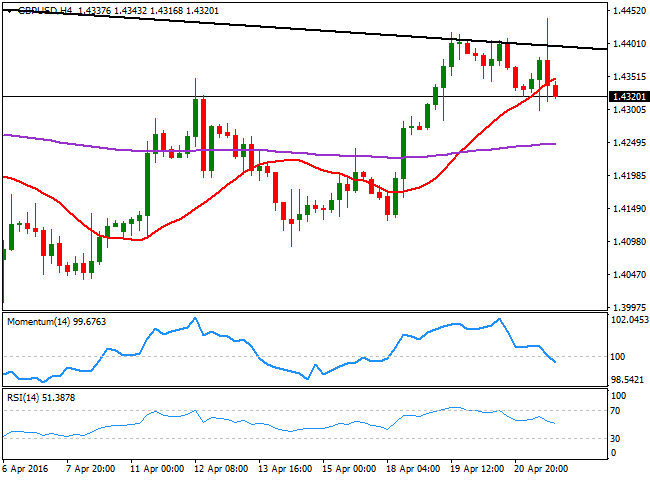
The Sterling rallied to a fresh 3week high against the greenback this Thursday, in spite of disappointing UK retail sales readings in March. Headline retail sales fell by 1.3% and the core reading was down 1.6%, compared to February, adding to the generally downbeat tone of UK data released earlier this week. The GBP/USD pair traded as high as 1.4439 within the ECB's press conference, to finally plunge to near 1.4300 ahead of the US close, holding nearby at the end of the day. The pair has failed for a third consecutive day to settle above the daily descendant trend line coming from February high, quite disappointing for bulls, which may be forced to continue taking profits out of the table this Friday. From a technical point of view, the pair is now biased lower, as in the 4 hours chart, the price is below a still bullish 20 SMA, whilst the Momentum indicator heads south below its 100 level, and the RSI also turned lower, and is aiming to break below its midline. At this point, the pair needs to extend below 1.4290, the immediate support to confirm a downward continuation that can see the price approaching the 1.4200 level during the upcoming 24 hours.
Support levels: 1.4290 1.4250 1.4210
Resistance levels: 1.4360 1.4405 1.4450
USD/JPY
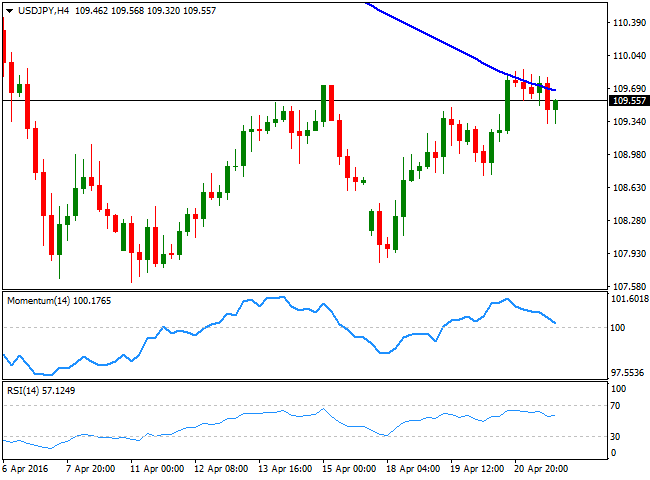
The USD/JPY pair traded in a tight 60 pips range, indifferent to market woes and ahead of economic policy meetings from both Central Banks next week. The US Federal Reserve will meet next Wednesday, and the BOJ on Thursday. And whilst the first is expected to offer a hawkish tone and anticipate an upcoming rate hike, the second is largely expected to extend easing measures, widening the imbalance between them and therefore implying a bullish rally, against the ongoing bearish trend. The pair flirted with the 110.00 figure at the beginning of the day, but as stocks turned lower in Europe and the US, chances of a breakout higher are now quite smaller. From a technical point of view, the pair has lost its bearish steam after bouncing multiple times from the 107.60 region, but it would take some follow through beyond 110.60/70, the lows set between February and March, to actually gain some additional upward potential. In the short term, the 4 hours chart is showing that the price struggled and finally retreated partially from a strongly bearish 100, while the Momentum indicator heads sharply lower, but remains right above its 100 level, and the RSI indicator has turned flat around 56, indicating a limited downward strength at the time being.
Support levels: 109.40 108.95 108.60
Resistance levels: 110.00 110.40 110.85
GOLD
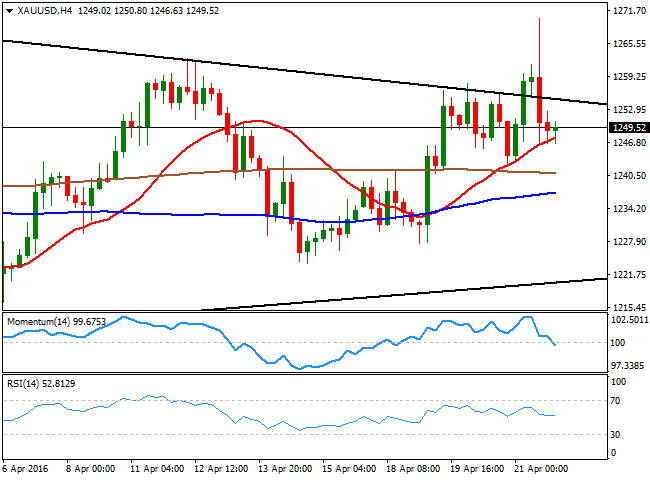
Spot gold rallied to a fresh monthly high of $1,270.23 a troy ounce, following a buoyed EUR, but turned south alongside with the common currency, closing the day right below the 1,250.00 level, as investors now look ahead to the US FED meeting next week. Also, a strong US employment report, showing that weekly unemployment claims fell to the lowest since 1973, added to the short term negative sentiment towards the commodity. The daily chart for spot shows that the price continues developing well above a mild bullish 20 SMA, while the technical indicators lack directional strength within positive territory, suggesting some further consolidation ahead. In the 4 hours chart, the 20 SMA is offering an immediate support around 1,247.00, whilst the Momentum indicator heads south below the 100 level and the RSI stands flat in neutral territory in line with further range trading as suggested by bigger time frames.
Support levels: 1,247.00 1,241.10 1,229.05
Resistance levels: 1,256.60 1,262.60 1,270.30
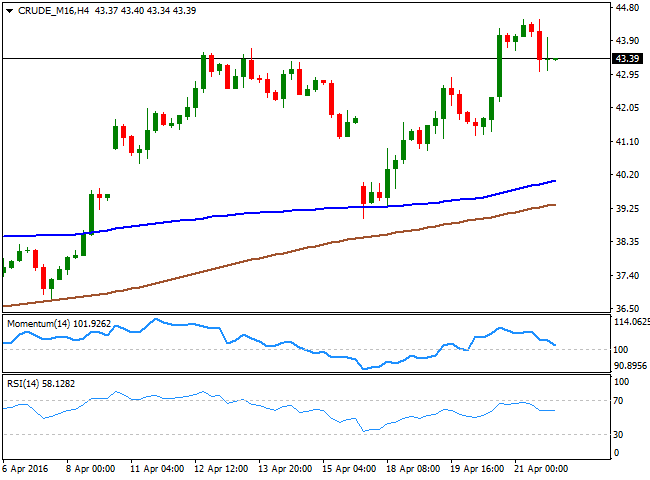
WTI CRUDE
US crude oil rallied to a fresh yearly high of $44.47, before turning lower and close the day in the red at $43.47 a barrel, weighed by broad dollar's strength, and renewed concerns over an oversupply, as the EIA reported this Thursday that supplies of naturalgas rose by 7 billion cubic feet for the week ended April 15. The commodity however, holds well on to gains weekly basis, and daily technical readings suggests that this latest decline could be just corrective, as the technical indicators have barely turned lower within overbought territory, whilst the price remains well above its 100 and 200 DMAs. In the shorter term, the 4 hours chart shows that the Momentum indicator heads south and approaches to the 100 level from above, while the RSI turned horizontal around 58, and the moving averages gain upward slopes well below the current level, all of which limits the downside. The daily low was set at 43.04, which means that if the price extends below it, the corrective movement can extend on Friday.
Support levels: 43.05 42.60 42.10
Resistance levels: 44.30 44.90 49.40
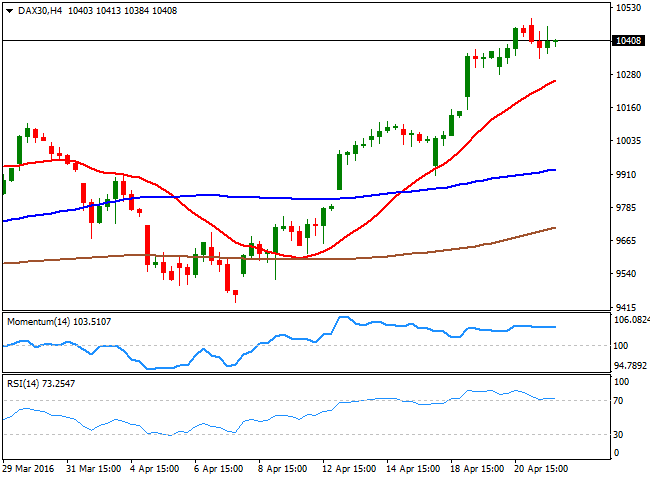
DAX
The German DAX closed the day at 10,435.73, up by merely 14 points after Mario Draghi failed to deliver some fresh stimulus´ announcements to boost speculative buying. Among local equities, Volkswagen was the daily winner, jumping 5.1% after the car maker moved closer to a deal to buy back or repair 600,000 US cars following its pollution test scandal, earlier this year. Daily basis, the index has managed to post a higher high and a higher low, which means that the bullish trend remains healthy, despite it fell further in after hours trading. Also, and in the same chart, the index is still developing above all of its moving averages, the Momentum indicator heads north above the 100 level, whilst the RSI barely retreats from overbought territory, limiting chances of a stronger decline as long as the index holds above 10,288 the 200 DMA.
Support levels: 10,369 10,278 10,223
Resistance levels: 10,491 10,569 10,627
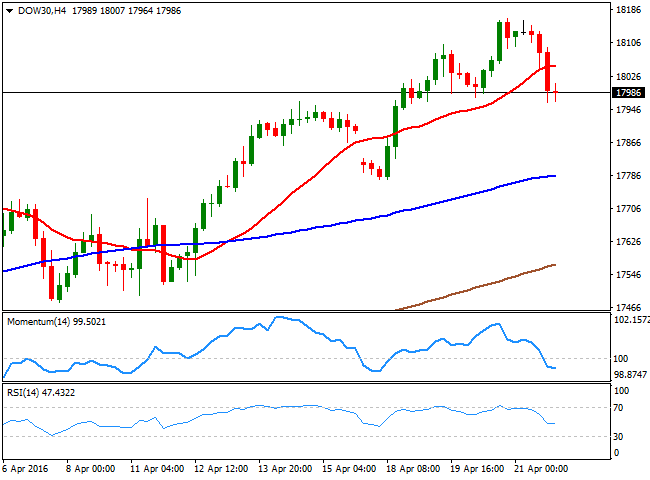
DOW JONES
Wall Street closed in the red, with the DJIA losing 113 points to close the day at 17,982.52, hit by poor earnings reports, and the fact that ECB's Draghi ruled out "helicopter money" saying that policy makers have never considered start printing money. The Nasdaq fell 0.5% to end the day at 4,945.89, whilst the SandP also retreated from yearly highs, shedding 10 points to close at 2,091.48. The DJIA was particularly weighed by Travelers, down 6% after the company reported earnings of $2.30 a share, down 10% from a year ago, hurt by hail storms in Texas. The DJIA holds near a fresh 3day, but the index is far from suggesting a longer term decline, as in the daily chart, the benchmark remains well above its 20 SMA, whilst the technical indicators have retreat partially within positive territory. In the 4 hours chart, however, the risk is now towards the downside, as the index broke below its 20 SMA, whilst the technical indicators head south within negative territory.
Support levels: 17,963 17,902 17,827
Resistance levels: 18,023 18,094 18,171
FTSE 100
The FTSE 100 closed the day lower, shedding 28 points to end at 6,381.44, weighed by a decline in oil's prices and investors' sentiment becoming sour, as the ECB's remained on hold, with no fresh stimulus measures now at sight. Once again, mining and energyrelated shares led the decline, with Anglo American losing 5.6% after the miner said diamond output fell 10% in the first quarter of this 2016. Still up on the week, the daily chart shows that the technical indicators have lost upward strength, but remain within bullish territory, whilst the index remains well above its moving averages, indicating further slides could be understood as corrective, even if the index reaches the 6,200 region. For the 4 hours chart, the downward potential is a bit stronger, as the index is now below a flat 20 SMA, whilst the technical indicators head lower around their midlines, not yet confirming additional falls. The daily low was established at 6,353, and a break below it will likely fuel the decline towards the 6,300 region, where buyers should emerge to favor a recovery this Friday.
Support levels: 6,353 6,306 6,243
Resistance levels: 6,399 6,440 6,488

![]()


")