Daily Analysis of Major Pairs for April 14, 2016
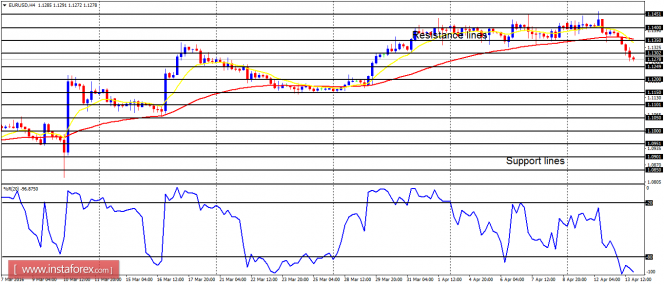
EUR/USD: The rally on the USD/CHF pair has forced EUR/USD to break southward. The price is now below the resistance line at 1.1300, going towards the support line at 1.1250. The price might even go below that resistance line, since further southward movement would be witnessed as USD/CHF journeys further north. There is a Bearish Confirmation Pattern on the chart: the EMA 11 has just crossed the EMA 56 to the downside as the Williams' % Range period 20 is in the oversold region.
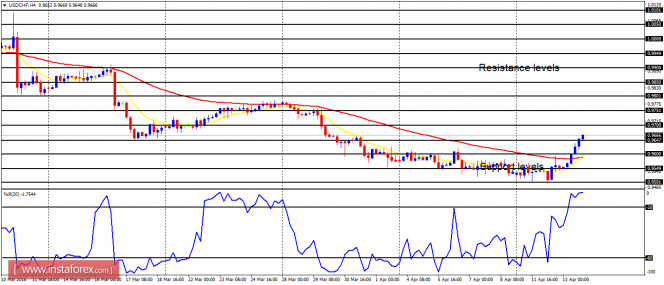
USD/CHF: The USD/CHF pair moved upwards seriously on Wednesday, owing to the weakness in the CHF. This kind of weak situation is visible on other CHF pairs, like NZD/CHF, AUD/CHF, CAD/CHF etc. Right now, the northward break on the USD/CHF chart has resulted in a bullish signal, which might aid the price to reach the resistance levels at 0.9700 and 0.9750 this week or next week. Some fundamental figures are expected today and they may have an impact on the market.
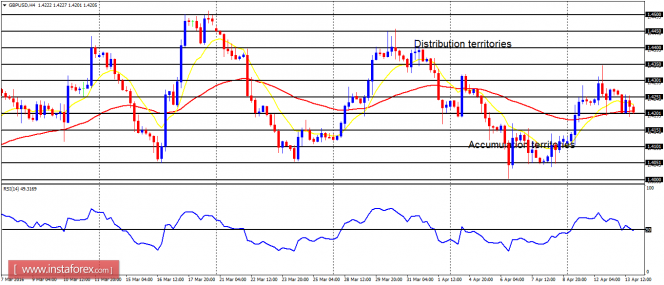
GBP/USD: The bullish bias on GBP/USD is in a precarious position. The bears are fighting desperately to render the bearish outlook invalid (which might become invalid once the price goes below the accumulation territory at 1.4100), though the bulls might be able to push the price up towards the distribution territories at 1.4350 and 1.4400.
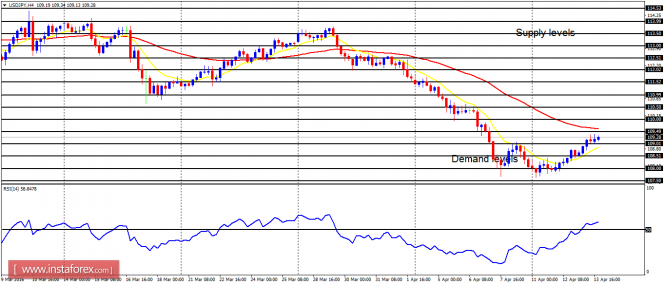
USD/JPY: So far this week, this currency trading instrument has moved upwards by 170 pips, but the dominant bias remains bearish. Two things would happen later this week: either the price continues going upwards, thereby rendering the dominant bearish bias invalid, or the price goes southwards to corroborate that bias.
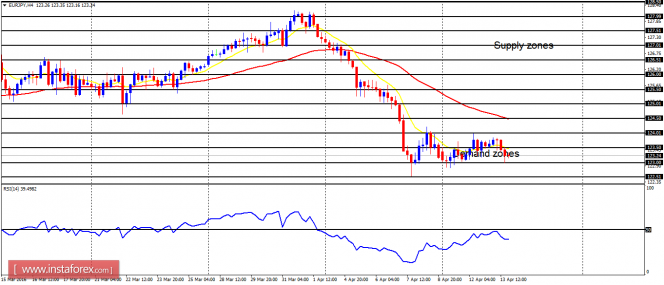
EUR/JPY: The bears are still willing to push the price further southward here, irrespective of what is happening to some JPY pairs, like AUD/JPY and NZD/JPY. The EMA 11 is below the EMA 56, and the RSI period 14 is below the level 50. This shows a bearish outlook on the market. When the price breaks out out of the current short-term consolidation, it would most probably go towards the demand zone at 122.50.
The material has been provided by InstaForex Company - www.instaforex.com


