Technical Analysis of Gold for March 31, 2016
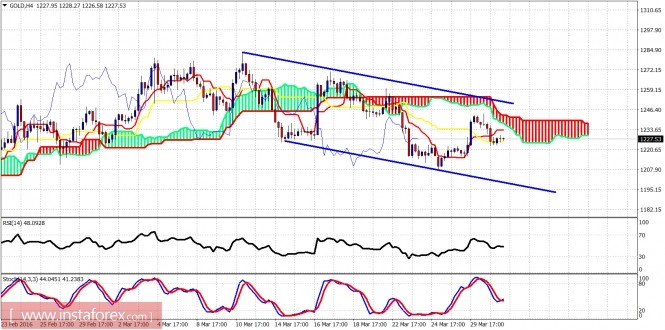
Gold remains inside the short-term bearish channel and as we expected from our previous analysis, the price has made a lower high around the $1,235-40 area and is pulling back down. The price remains in a corrective phase, so eventually it is expected to reach below $1,190.

Blue lines - bearish channel
Gold remains below the Kumo (cloud) on the 4 hour chart and with a lower high and reversal we remain in a bearish trend. Support is at $1,208 and resistance at $1,250. A break above $1,250 could even give us a new higher high towards $1,300, but this scenario has less chances.

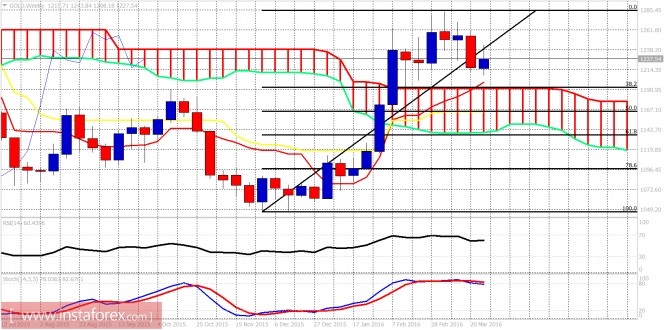
The weekly chart is bearish for the next two to three weeks. Why? The Stochastic oscillator is turning lower below 80 from overbought levels and this is a trend reversal sign. A significant top has already been made and the price has already started a reversal. Eventually I expect prices to reach $1,150-$1,100 to complete the pullback and resume the uptrend.
The material has been provided by InstaForex Company - www.instaforex.com


