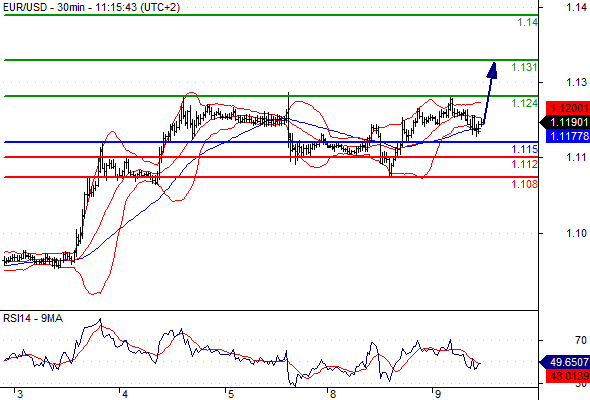
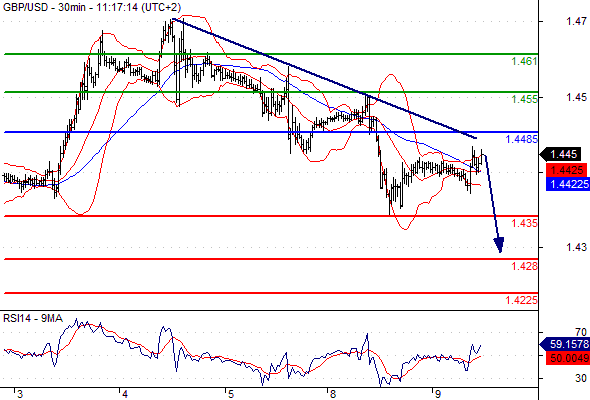
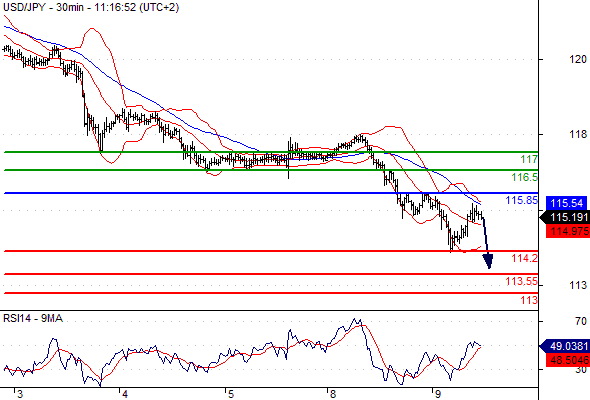
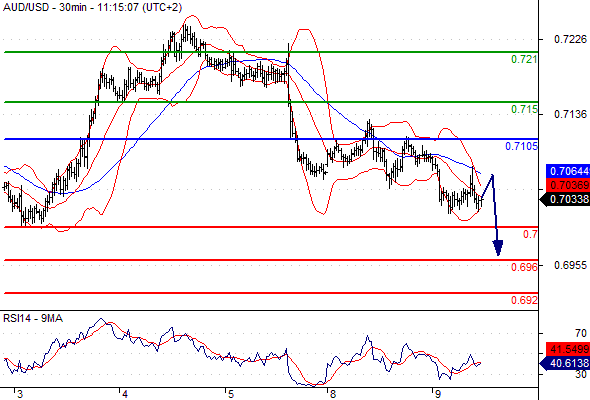
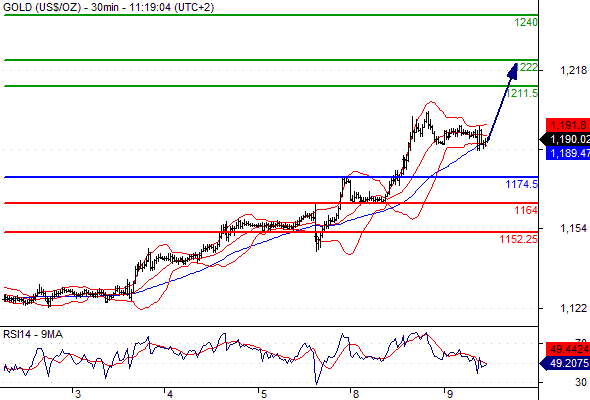
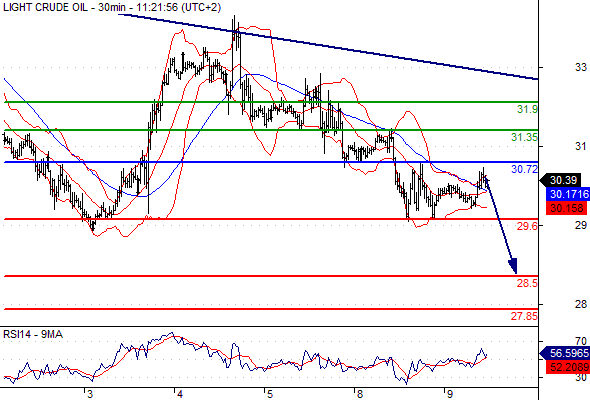
Charts All Blogs / My Trading / Charts Charts Pre US Open, Daily Technical Analysis Tuesday, February 09, 2016 9 February 2016, 12:48 Mohammed Abdulwadud Soubra 0 189 Pre US Open, Daily Technical Analysis Tuesday, February 09, 2016 Please note that due to market volatility, some of the below sight prices may have already been reached and scenarios played out. EUR/USD Intraday: further advance. Pivot: 1.1150Most Likely Scenario: long positions above 1.1150 with targets @ 1.1240 & 1.1310 in extension.Alternative scenario: below 1.1150 look for further downside with 1.1120 & 1.1080 as targets.Comment: the RSI lacks downward momentum. GBP/USD Intraday: capped by a negative trend line. Pivot: 1.4485Most Likely Scenario: short positions below 1.4485 with targets @ 1.4350 & 1.4280 in extension.Alternative scenario: above 1.4485 look for further upside with 1.4550 & 1.4610 as targets.Comment: The pair is showing a pattern of lower highs and lows. USD/JPY Intraday: the downside prevails. Pivot: 115.85Most Likely Scenario: short positions below 115.85 with targets @ 114.20 & 113.55 in extension.Alternative scenario: above 115.85 look for further upside with 116.50 & 117.00 as targets.Comment: the RSI is mixed to bearish. AUD/USD Intraday: the downside prevails. Pivot: 0.7105Most Likely Scenario: short positions below 0.7105 with targets @ 0.7000 & 0.6960 in extension.Alternative scenario: above 0.7105 look for further upside with 0.7150 & 0.7210 as targets.Comment: a break below 0.7000 would trigger a drop towards 0.6960. Gold spot Intraday: the upside prevails. Pivot: 1174.50Most Likely Scenario: long positions above 1174.50 with targets @ 1211.50 & 1222.00 in extension.Alternative scenario: below 1174.50 look for further downside with 1164.00 & 1152.25 as targets.Comment: the immediate trend remains up and the momentum is strong. Crude Oil (WTI) (H6) Intraday: under pressure. Pivot: 30.72Most Likely Scenario: short positions below 30.72 with targets @ 29.60 & 28.50 in extension.Alternative scenario: above 30.72 look for further upside with 31.35 & 31.90 as targets.Comment: as long as the resistance at 30.72 is not surpassed, the risk of the break below 29.60 remains high. To add comments, please log in or register Multi Timeframe Indicator Suite: user guide for MT5 and MT4 Charts 31 0 Risk/Reward vs Win Rate: The Breakeven Line Every Strategy Must Beat Trading Strategies 29 0 Quantum Queen X Review: I Tried to Break It My Trading 40 0 SX Chart Tools – User Guide: Style and Sync Your MT5 Charts Charts 35 0 Recovery factor: how many times an account has already earned back its worst fall Statistics 33 0 Worst Month by Money vs by Percent in 8 EA Backtests: A Different Month in 7 of 8; MEGAMAX DONCHIAN's Deepest: -21.75% Trading Strategies 36 0 Tick Volume in MT5: What It Measures and When You Can Trust It Trading Strategies 46 0 The ICT Liquidity Matrix: Automating New York Session Sweeps & Market Structure Shifts on NAS100 Trading Strategies 51 0 1 Quantitative 1-Minute Scalping: Combining Stochastic Momentum with Standard Deviation Volatility Regimes on MT5 Trading Strategies 65 0 1 123 More than $2 trillion wiped off the Nasdaq 100 index 207 AiX Gold: Built for Gold. 98 TwoKey AI for MetaTrader 5: how it works, how to set it up, and how to test it safely forex technical analysis eurusd EUR/USD gbpusd gold usdjpy GBP/USD usd/jpy usd Trading AUD/USD usd/chf S&P 500 forecast usd/cad Fed bitcoin Fxwirepro dax fundamental analysis VistaBrokers Gold spot ($) Silver spot ($) Crude Oil (WTI) USD/TRY audusd EUR forex news ECB