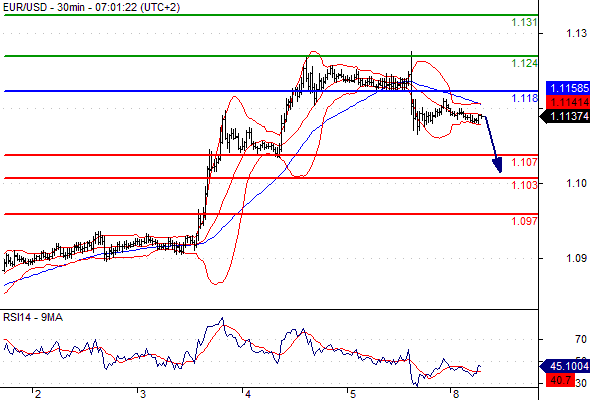
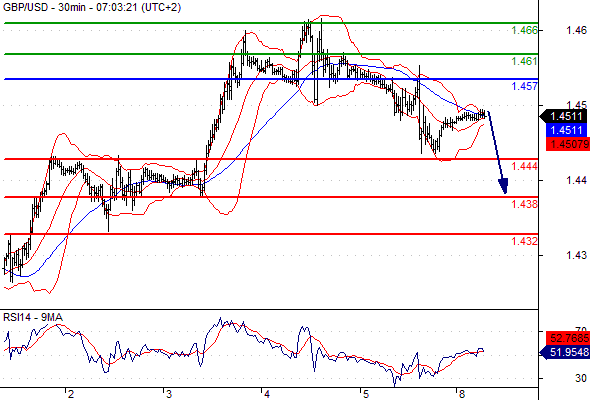
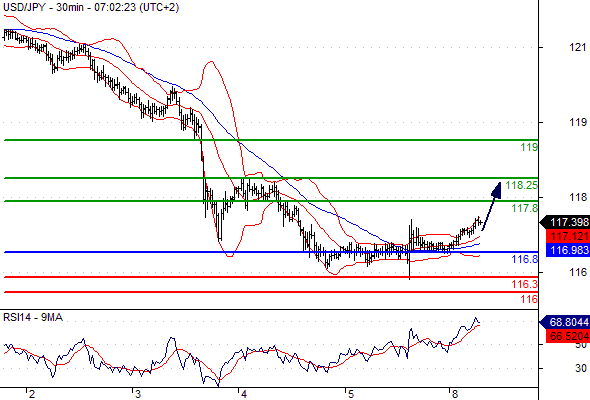
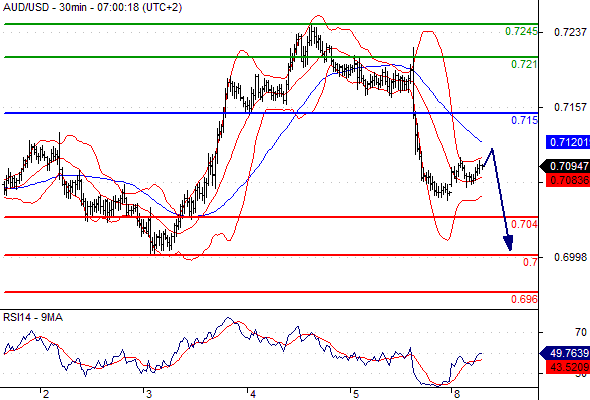
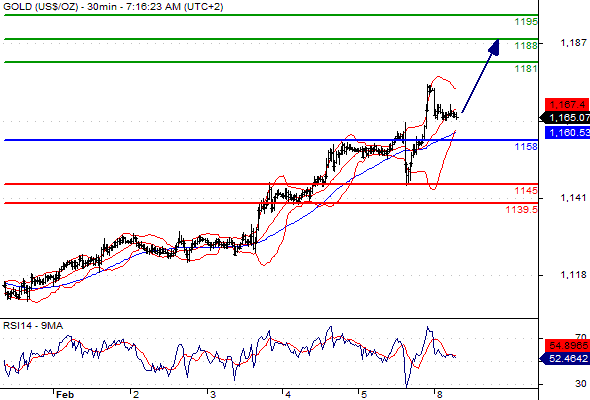
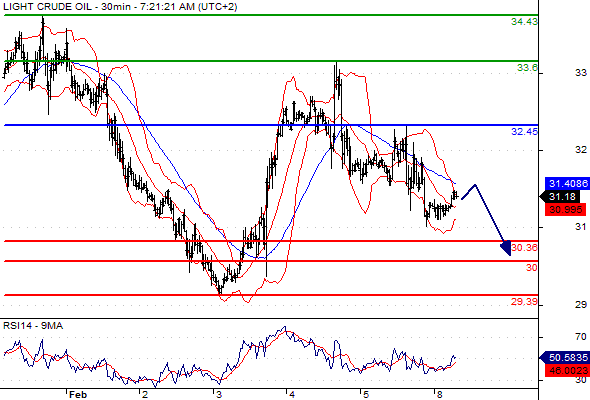
Charts All Blogs / My Trading / Charts Charts Pre European Open, Daily Technical Analysis Monday, February 08, 2016 8 February 2016, 08:18 Mohammed Abdulwadud Soubra 0 168 Pre European Open, Daily Technical Analysis Monday, February 08, 2016 Please note that due to market volatility, some of the below sight prices may have already been reached and scenarios played out. EUR/USD Intraday: key resistance at 1.1180. Pivot: 1.1180Most Likely Scenario: short positions below 1.1180 with targets @ 1.1070 & 1.1030 in extension.Alternative scenario: above 1.1180 look for further upside with 1.1240 & 1.1310 as targets.Comment: the RSI is bearish and calls for further downside. GBP/USD Intraday: under pressure. Pivot: 1.4570Most Likely Scenario: short positions below 1.4570 with targets @ 1.4440 & 1.4380 in extension.Alternative scenario: above 1.4570 look for further upside with 1.4610 & 1.4660 as targets.Comment: as long as the resistance at 1.4570 is not surpassed, the risk of the break below 1.4440 remains high. USD/JPY Intraday: the bias remains bullish. Pivot: 116.80Most Likely Scenario: long positions above 116.80 with targets @ 117.80 & 118.25 in extension.Alternative scenario: below 116.80 look for further downside with 116.30 & 116.00 as targets.Comment: The 116 daily strong supports is expected to favour a rebound. The 20 and 50-period moving averages crossed upward. AUD/USD Intraday: under pressure. Pivot: 0.7150Most Likely Scenario: short positions below 0.7150 with targets @ 0.7040 & 0.7000 in extension.Alternative scenario: above 0.7150 look for further upside with 0.7210 & 0.7245 as targets.Comment: even though a continuation of the technical rebound cannot be ruled out, its extent should be limited. Gold spot Intraday: the upside prevails. Pivot: 1158.00Most Likely Scenario: long positions above 1158.00 with targets @ 1181.00 & 1188.00 in extension.Alternative scenario: below 1158.00 look for further downside with 1145.00 & 1139.50 as targets.Comment: the RSI lacks downward momentum. Crude Oil (WTI) (H6) Intraday: under pressure. Pivot: 32.45Most Likely Scenario: short positions below 32.45 with targets @ 30.36 & 30.00 in extension.Alternative scenario: above 32.45 look for further upside with 33.60 & 34.43 as targets.Comment: the RSI is bearish and calls for further downside. To add comments, please log in or register Profit Factor by Month vs by Trade in 9 EA Backtests: Monthly Was 1.26x to 4.56x Higher; GOLD TRIPWIRE 12.41 vs 2.72 Trading Strategies 25 0 Why Would We Launch a Trading Signal With Only $25? My Trading 30 0 Profit, Loss, and Profit Again 💰 CALAVRY SYSTEM My Trading 31 0 Pending stop orders and why my EAs need a VPS Trading Strategies 36 0 How to Trade Gold on MT5: Start on Demo, Step by Step My Trading 31 0 A trading journal: what to record, what to measure and how to review trades Statistics 26 0 How big can one gold day get? 20 years of XAUUSD data Statistics 36 0 Did every trade go in with a stop? Check the history before you copy or buy Trading Strategies 40 0 First 3 vs Last 3 Full Years in 9 EA Backtests: The Later Block Returned More in 6; BITCOIN COMET +939.1% vs +120.9% Trading Strategies 70 0 686 AiX Gold: Built for Gold. 197 Technical Analysis — November 3, 2026 174 Oil plummeted by 7%: why Brent and WTI face another drop forex technical analysis eurusd EUR/USD gbpusd gold usdjpy GBP/USD usd/jpy usd Trading AUD/USD usd/chf S&P 500 forecast usd/cad Fed bitcoin Fxwirepro dax fundamental analysis VistaBrokers Gold spot ($) Silver spot ($) Crude Oil (WTI) USD/TRY audusd EUR forex news ECB