

3 Steps to Swing Trading in the CFD Market
When traders say they are swing trading, they are generally referring to both the length of time and the style of trades that are being executed. Most swing trades are placed in the direction of a trend after a pullback has occurred and will remain open anywhere from a few hours up to a few days. Today, we take a look at a 3 step process for swing trading CFDs using a Moving Average, Slow Stochastic, and Support/Resestance levels.
Step 1: Setup 50-Day Simple Moving Average on a 4-Hour Chart
Our first task is to properly set up the CFD chart for swing trading. We prefer using a 4-hour chart as our primary chart since it is a medium time frame. But, because we are wanting to only trade in the direction of the longer term trend, we want to add a 50-period moving average that is based on Daily candles.
When you add an indicator, like a moving average, there should be a parameters window that allows the source data to reference a different time frame than the time frame shown on the chart itself. In the picture below, we can see how we chose D1, or Daily, for our data source.
We will be using this 50-Day Moving Average as our trend filter. We will only allow ourselves to look for buying opportunities when price is above the MA and will only allow selling opportunities when price is below the MA. This ensures that we are trading in the direction of the overall trend each time we place a trade.
Step 2: Enter Trades Based on Slow Stochastic
Our next step is to add the Slow Stochastic indicator onto our charts. Many traders prefer setting their Slow Stochastic to (15, 5, 5) rather than the default (5, 3, 3). This will slow the indicator down a bit more than the default settings and can create more reliable signals. (Please note that the Slow Stochastic will be based on the default 4-Hour time frame that the price chart is set to.)
Reading the signals for this indicator is pretty straight forward. There are two lines, the blue K line and the red D line. Trade signals occur when the K and the D lines cross each other when they are either above 80 or below 20.
So for example, if the Blue K line crosses above the Red D line while both lines are below 20 that would be a signal to buy; and if the Blue K line crosses below the Red D line while both lines are above 80 that would be a signal to sell.
The following chart shows us an example of a downtrend (price below 50-day MA) and the corresponding sell signals provided by the Slow Stochastic.
Selling When Price Below 50-Day MVA and SSD Signals
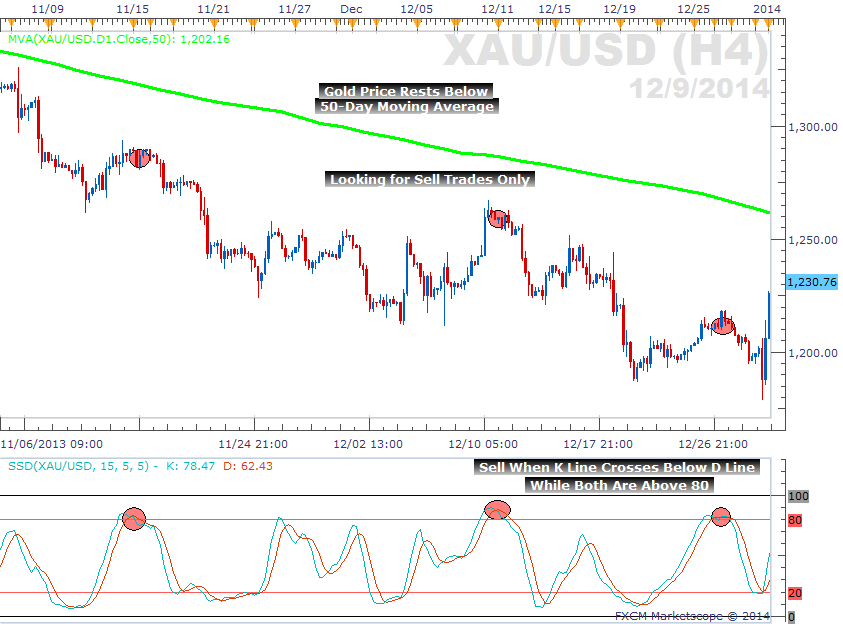
Past performance is no indication of future results.
The following chart shows us an example of an uptrend (price above 50-day MA) and the corresponding buy signals provided by the Slow Stochastic.
Buying When Price Above 50-Day MVA and SSD Signals
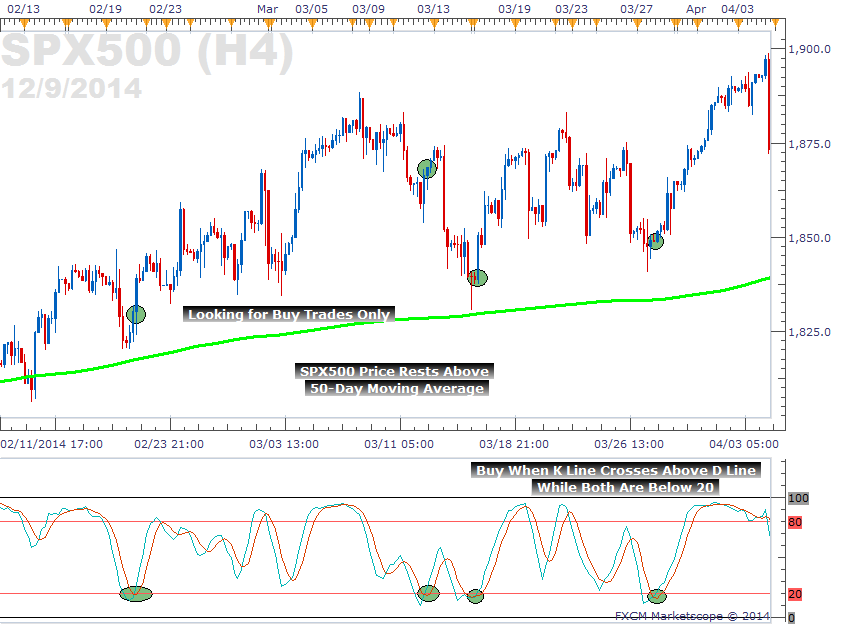
Past performance is no indication of future results.
Step 3: Set Exits Based on Support/Resistance Levels
Now that we have our entry logic in place, we need to discuss where these CFD swing trades can be closed out. There is no tool required to properly set our stop and limit. We will simply use prior price action as our guide.
As a basic rule of thumb, we want to set our stop loss beyond the closest swing high or swing low and set our profit target within the closest swing high or swing low. This can make our stop loss more difficult to hit and our profit target easier to hit.
The chart below shows a buy signal given on the SPX500. At that time, the most recent swing low had occurred 2-3 candles beforehand. As a rule, we will place our stop loss beyond this support level by a few points. (The actual amount beyond we set our stop will vary from instrument to instrument. Our goal is to have sufficient enough gap where if our stop loss is hit, it’s because a true break of support occurred and not just a ‘test’ of support).
Exit Strategy Based on Support/Resistance
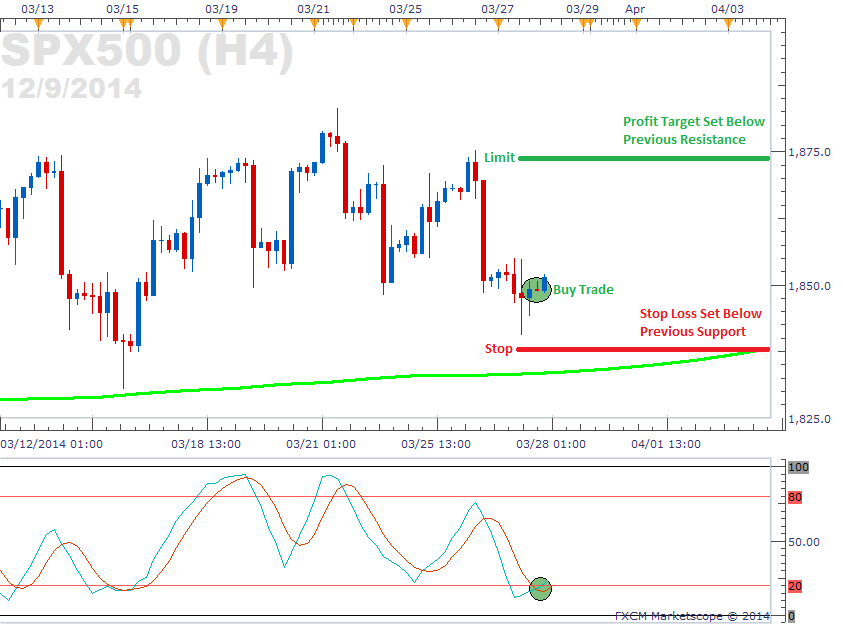
Past performance is no indication of future results.
Our profit target can then be set just below the most recent swing high. This allows us to take profit even when price merely tests the closest resistance.
Notes:
Swing trading is a medium term strategy that can be easily implemented in 3 simple steps. Once we set our chart properly to 4-hours with a 50-Day MVA, add a Slow Stochastic and make note of swing highs and swing lows, this CFD strategy almost trades itself.


")

![[XAUUSD]: Weekly Liquidity Activation Points (timings), June 22-26, 2026](https://c.mql5.com/6/1013/splash-preview-771790.png "[XAUUSD]: Weekly Liquidity Activation Points (timings), June 22-26, 2026")