

0
1 279
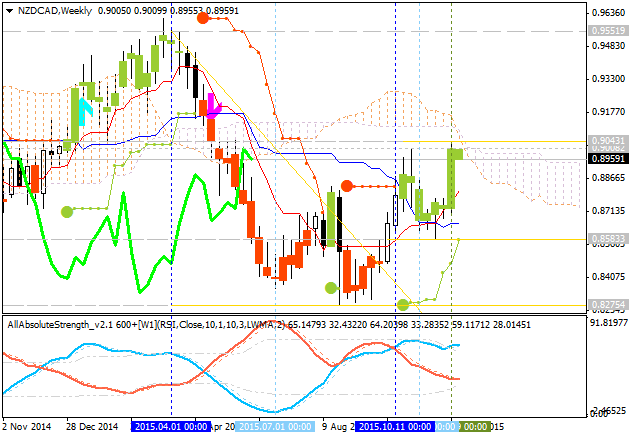
NZD/CAD: breakout to reversal. The pair is bearish on
market condition: price is located near and below Ichimoku cloud in the primary bearish area of the chart with the local uptrend as the secondary market rally breaking 0.9043 key reversal resistance level from below to above for the bullish reversal to be started. Chinkou Span line is
breaking the price to above for a good bullish breakout to be started.
The price is rlocated within the following key reversal support/resistance levels:
- 0.9043 key reversal resistance level located on the border between the primary bearish and the primary bullish trend on the chart, and
- 0.8275 support level located far below Ichimoku cloud in the bearish area of the chart.
There are 4
simple scenarios for the price movement for the week and in a long-term situation:
- bullish breakout in case the price breaks 0.9043 resistance on close weekly bar
with the bullish reversal to be started with the secondary ranging,
- bearish trend to be continuing in case the price breaks 0.8275 support from above to below,
- or the ranging within the levels.
| Resistance | Support |
|---|---|
| 0.9043 | 0.8583 |
| 0.9551 | 0.8275 |


")
")
")