

BULL MOUNTAIN:

VIDEO OF INDICATOR:
This indicator shows overbought and oversold market, analyzing the main oscillators of the market and by a filter mark the points of change in the trend.
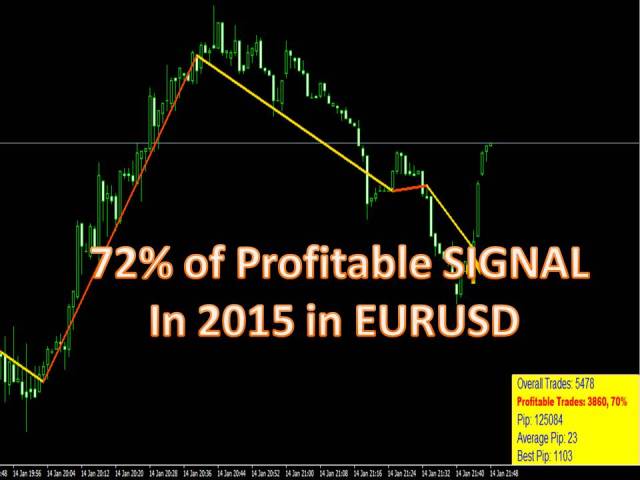
This indicator detectec a 71% profit signals on the EURUSD in the last year.
The mean a pip for sign (both winners and losers) is 31 pip.

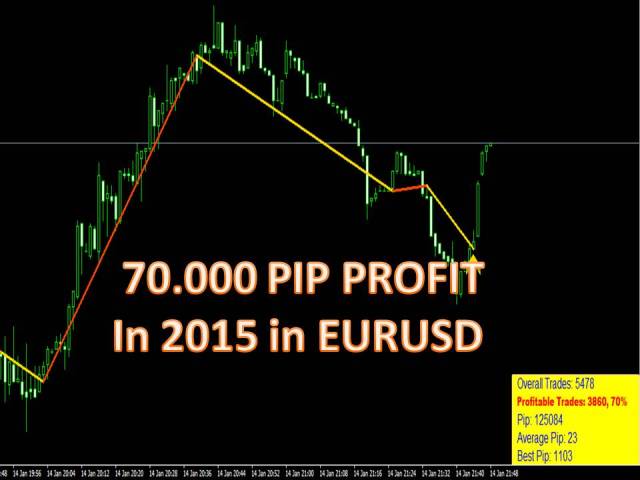
Get more than 70,000 in the last year pip
Let's see how the indicator behaves:
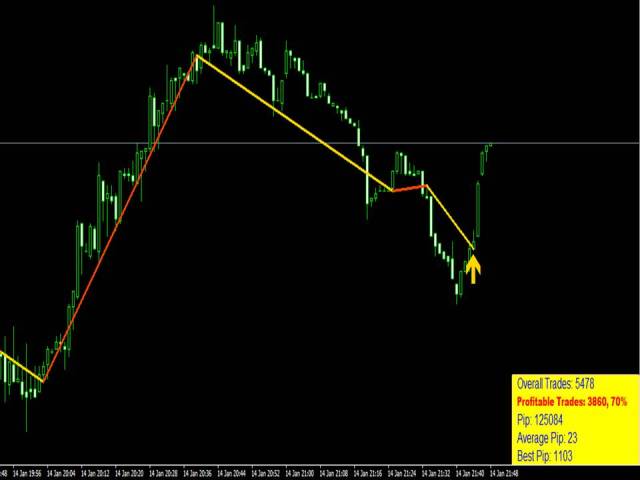
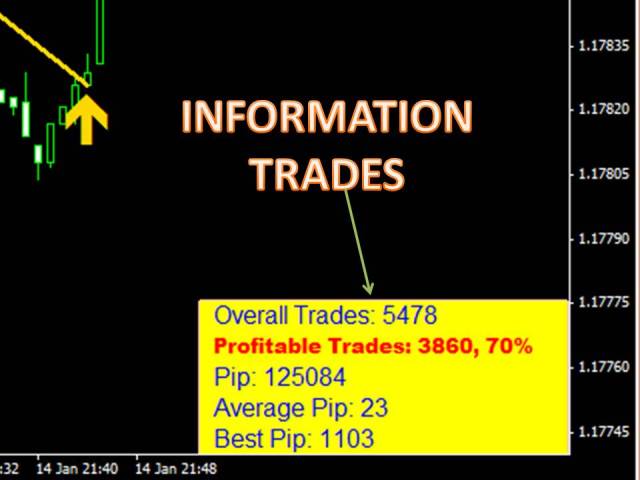
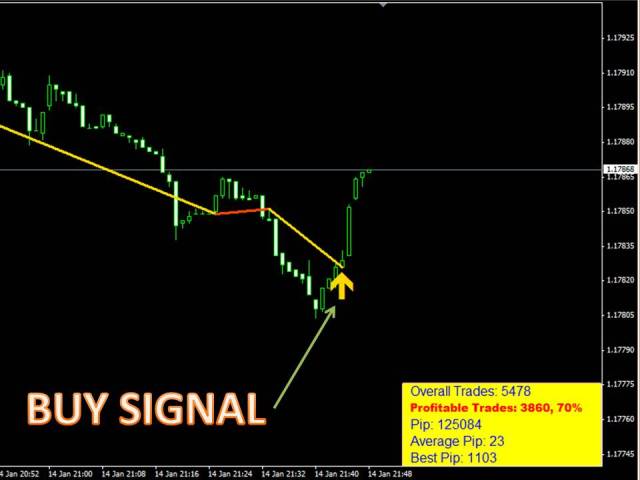
The indicator shows on the screen all signals given, the total winning signals and their percentage, the number of pip to have won (or lost if the number is negative), the average pip signal and the best result obtained .
If we are in a selling signal at the point where the signal came an arrow pointing upwards is displayed.
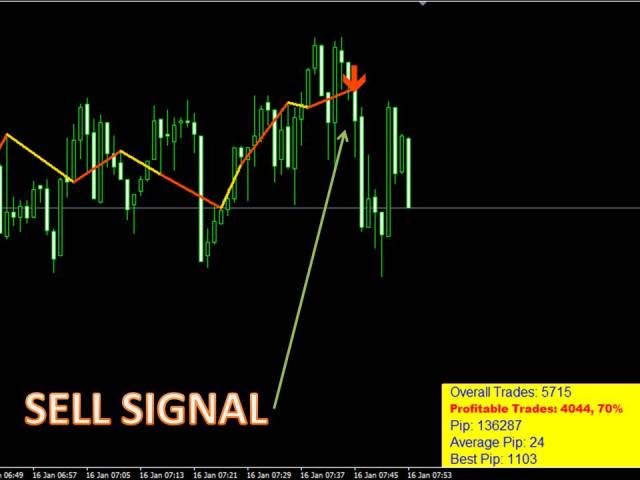
If the last signal is bearish we will see a downward arrow. When the signal ends a line connecting the two signals and a signal is brand new.
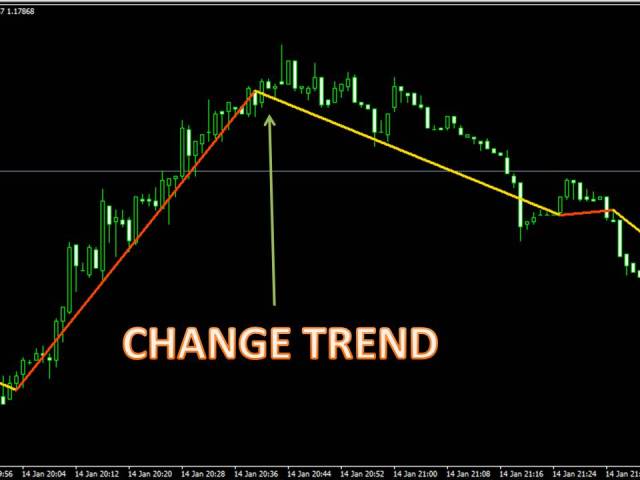
Let's look at a detection of trend exhaustion and rotation thereof in this case is an upward trend turns bearish.
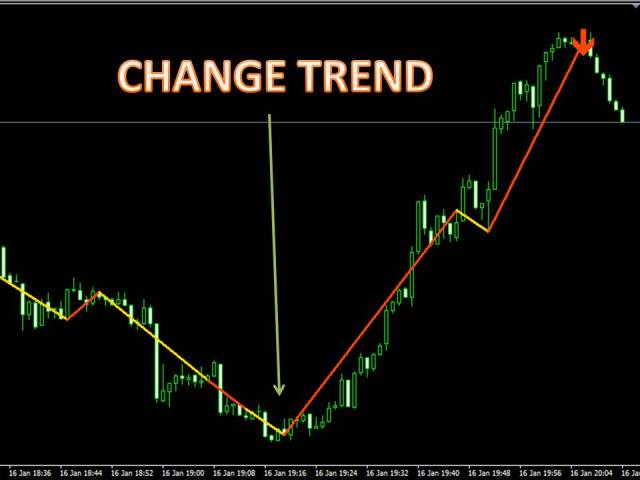
We can also observe the opposite change.
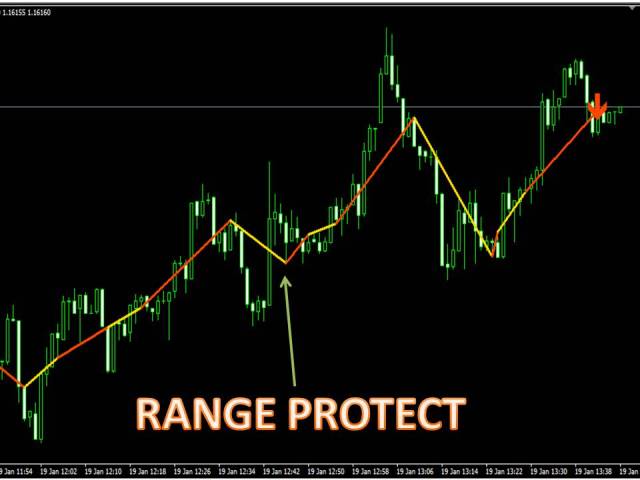
The system has characteristics making protection ranges emerge unscathed from these complex areas of operation.
A greeting and I hope your comments.


")
![[XAUUSD]: Weekly Liquidity Activation Points (timings), June 22-26, 2026](https://c.mql5.com/6/1013/splash-preview-771790.png "[XAUUSD]: Weekly Liquidity Activation Points (timings), June 22-26, 2026")
")