
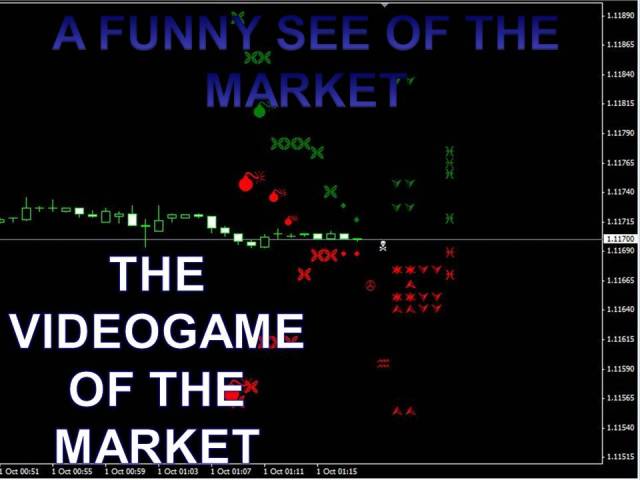
Map of batterfield a funny see of de videogame of the market.

MAP OF THE BATTLE: THE VIDEO GAME MARKET:
Map of battlefield: It's a funny look at the market. It allows us to look at the market as if it were a video game. It shows the supports and resistances below and above the price (trenches), showing where the bulls and bears are hidden armies. Trend lines that mark the underlying trend in different time frames is marked as bombs are dropped from the trenches the color and direction of the pumps shows the trend, the larger the stronger is the trend pumps this temporality. Ideally, all pumps are the same color. On the right price and in the form of nuclear sign have marked the pivot point and the point clique. The color of the dot marks the point that dominates us and when that point is attacked becomes a blank sign of death. But right we have zero points. They are crossing points where price levels 0, are fences that offer resistance to the price, when that fence is trying to be passed is shown as a sign of death. But we still have the right Fibonacci points. There are two types of Fibonacci, moving troops to move around the front, and supply points, which shows areas of resistance that oppose difficulty advancing army. In the far right of the chart levels Murray color shows who occupies them and if they are being attacked shown. They appear as a sign of death.
PART OF THE BATTLE FOR THE GENERAL TRADER:
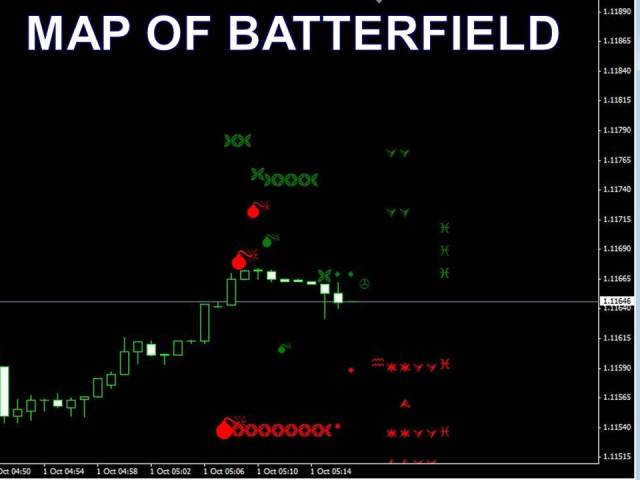
In this map of the war between bears and bulls are observed, we see how the bear has a strong army trench, from which this dropping bombs powerful bull front. Also we observe how right the bear army has two areas of high resistance defensively well structured and impede the progress of the bulls. Bulls are conducting a low-intensity offensive in smaller time frames, dropping bombs low power impact. Also we observe how the lines of trenches are located to empty levels, and the front is estructurad levels in poorly organized. I hope that with this information the general trader chooses the most appropriate strategy to beat the market.
STANDING BULL ARMY:
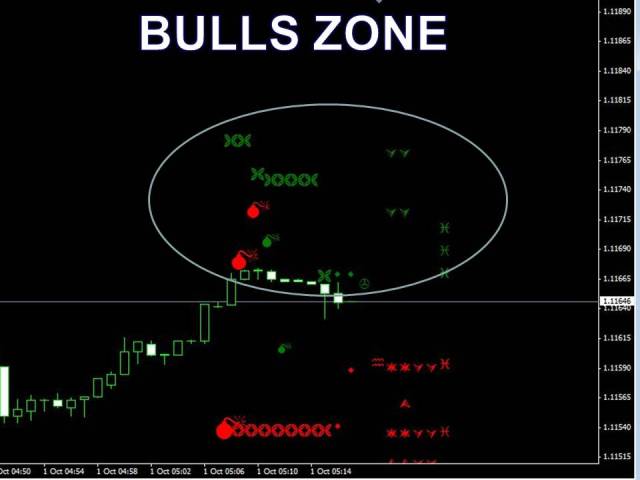
Following is the report of the intelligence situation bull army. My general are being attacked by bears with high caliber weapons. Our army is fighting back with low intensity ammunition, because we do not have guns positioned in the trend line. We trenches arranged on three levels, the front line is reinforced with a fortified line. A first line of defense in two highly gifted levels and other fortified area in the rear.
In frontlines have a staff of elite army, the pivot section. And several Murray reinforcement units in the rear. Fibonacci units are in reserve, waiting to be activated.
No zero units have been eliminated and are hoping to form new units and send them into battle.
STANDING BEAR ARMY:
Army intelligence report OSO. My general are doing a high intensity borbandeo the bull lines. Our defensive lines are well structured in the form of trenches, the frontline is structured in two levels and are receiving incoming fire of low intensity. We infer that the army has no bear high-power guns in front.
The pivot units were defeated and have no new pivot units at the front. We are waiting for new units to position them in position.
The units are grouped zero waiting to be activated along with the Fibonacci and Murray, the have structured on two levels and are awaiting training they need your participation
ARTILLERY:
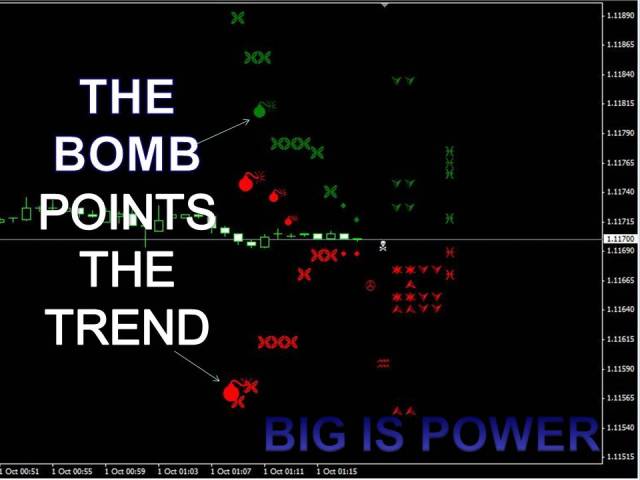
The domain of artillery (predominant trend) is presently bear while the bulls have pipes but only average power and dominate positions 5 trend. This structure simulates the dominant trend on 5 timeframes, the larger of the highest pump and therefore more powerful is the time frame. This area of the map tells us who dominate the market in the past and who has strength to withstand a background or make an offensive attack.
TRENCHES:
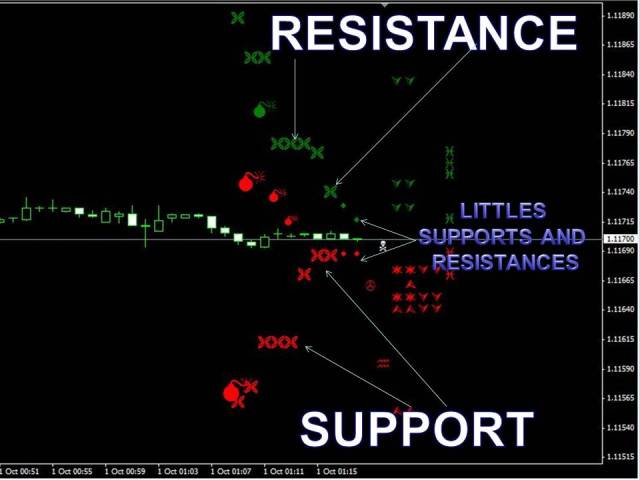
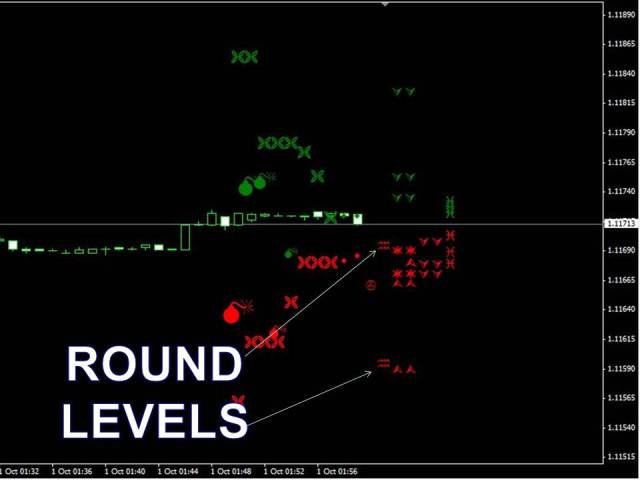
The trenches represent the points of support and resistance at different levels, and the map provides the front lines at two levels with diamond-shaped points. We reported levels of drag prices both bull and bear side and thus help us to position ourselves in the market.
PIVOT ELITE UNITS AND CAMARILLA:
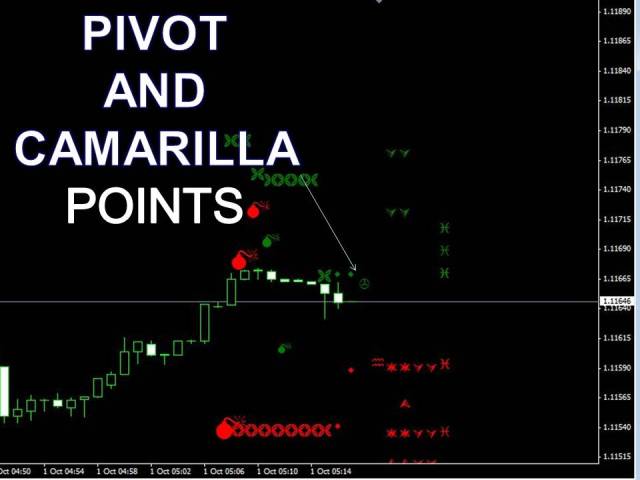
Brands as nuclear symbol, we mark the pivot levels and clique are points where the price found resistance and may have ambushed by the market. These are important points to be areas to be taken into account in our strategy.
When these points are having influence on the price they change their drawing by a white skull
ZERO UNITS:
When these points are having influence on the price they change their drawing by a white skull.
MURRAY UNITS:
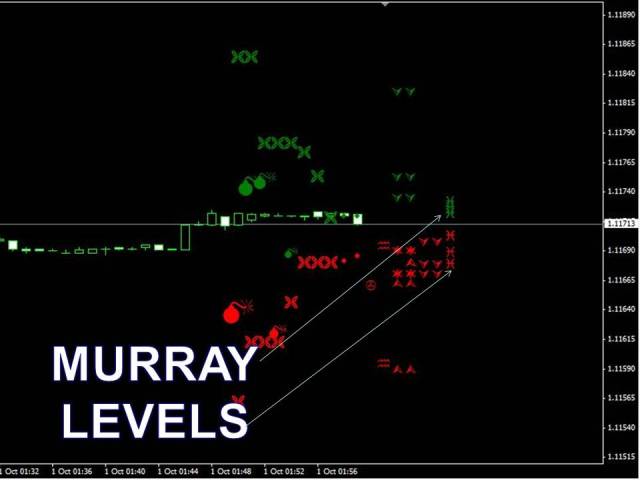
The Murray are young inexperienced units that can slow the progression or be defeated easily. They are a mystery the influence they can have on the market, but associated with other units can tip the battle in your favor.
When these points are having influence on the price they change their drawing by a white skull
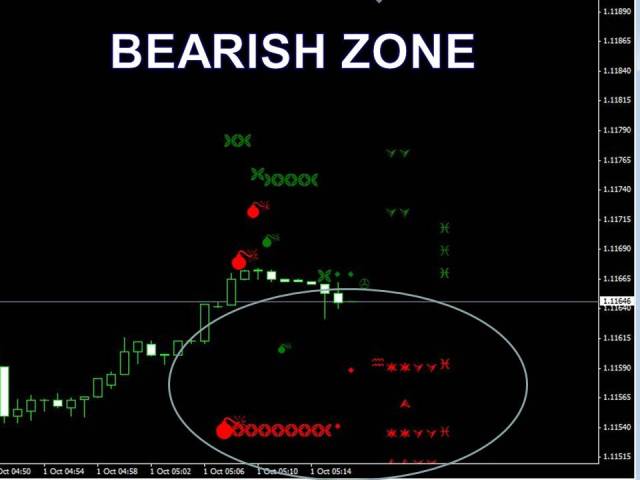
Battle Zone:
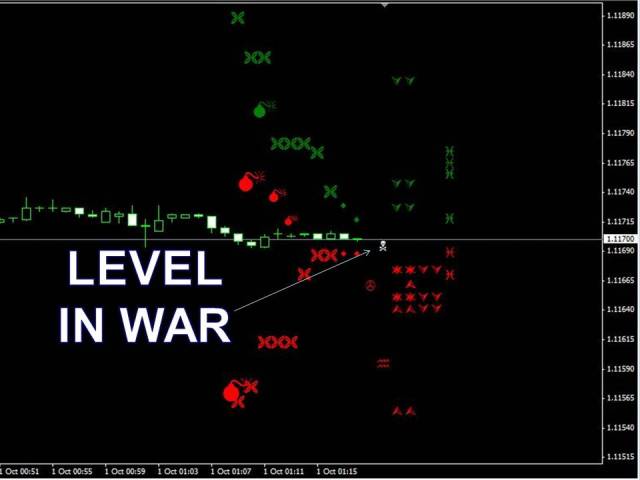
When a level is being attacked and having influence on the price marked on the chart with the symbol of death in white.
DEFENSIVE LINE:
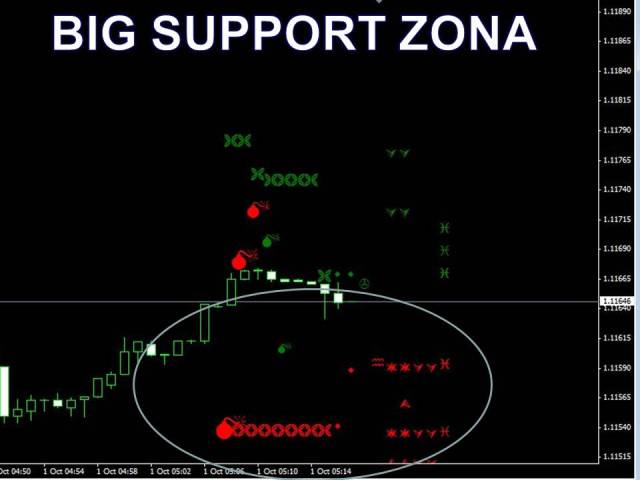
Sometimes the market shows strong defensive areas logically be difficult to overcome the rival army.
I hope you enjoy the video game market and may have a funny view of the market.ado nos
muestra fuertes zonas defensivas que lógicamente serán difíciles de superar por
el ejercito rival.


