


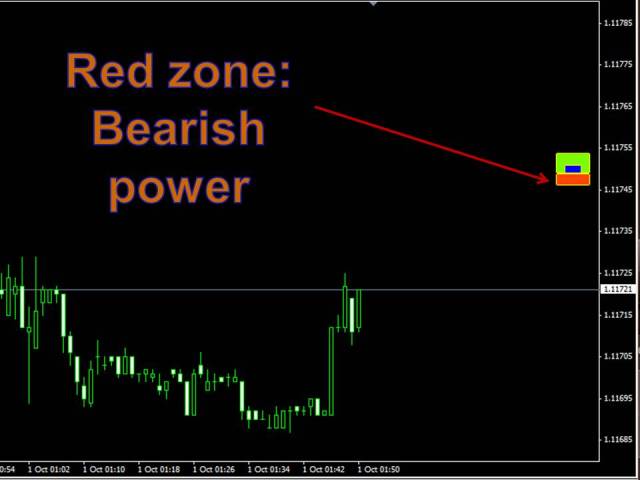
The red band (Red zone) shows us the power we have had bears in recent market movements, the higher the larger is the power of that movement. Therefore a large red band show us a downtrend line, which is the operating framework of the market battle.
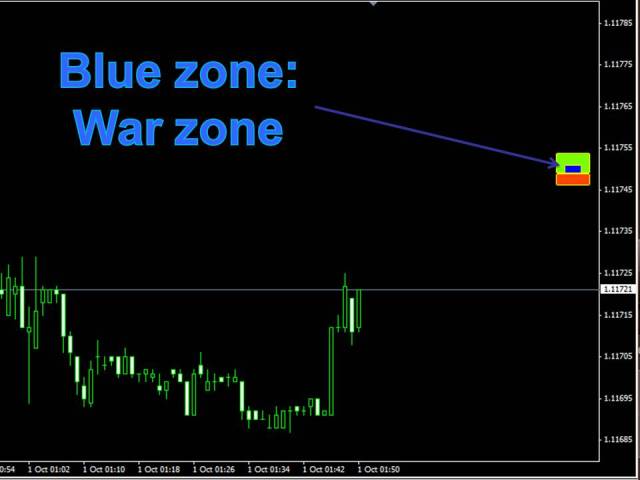
The blue band (Blue zone) shows the front lines, that is, as is moving the market today, who is winning the battle front and allows us to anticipate trend changes, as if the blue band out in contrast to the dominant band end, we are at the beginning of a counter in the underlying trend. If instead it is within the dominant band, the battle continues its advance in favor of the underlying trend.
Therefore we are looking at an indicator that shows the market from a different perspective that can help us position ourselves in the market.
This indicator reads the market and shows a graph of the same information, but does not give direct entry to the market, being the same for the operator who interprets the data displayed on the screen and on the basis of them decide to trade on the market
Let's look at some scenarios:
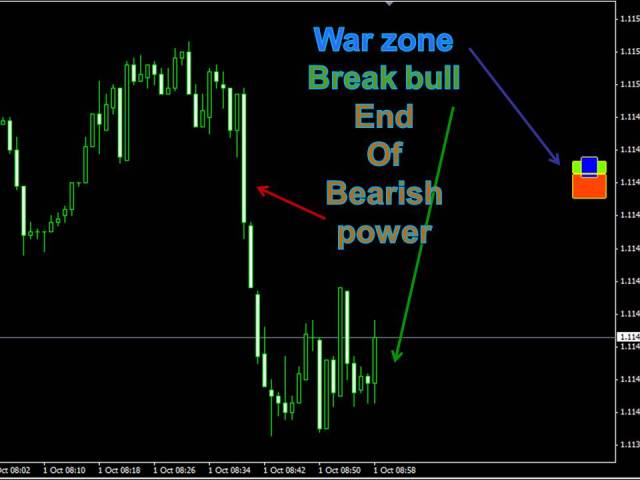
SCENARIO 1: BREAKING bullish bullish momentum:
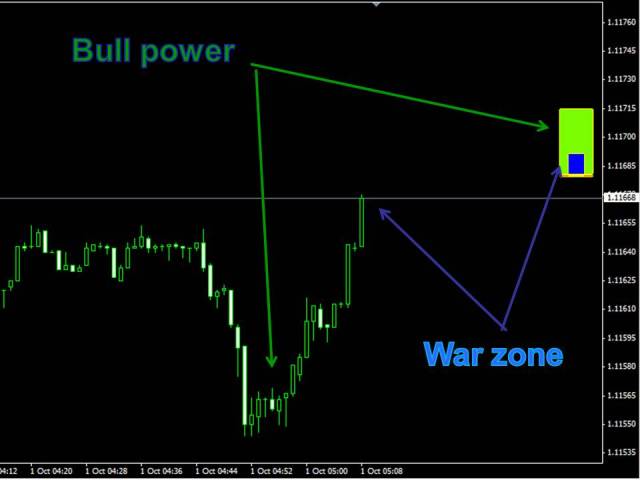
Watch as the green area is wide and powerful and also the progress of the war zone occurs in favor of the motion, the conclusion to be drawn from this is that the upward trend develops smoothly and no turnaround in sight .
SCENARIO 2: BREAKING WITH bearish momentum:
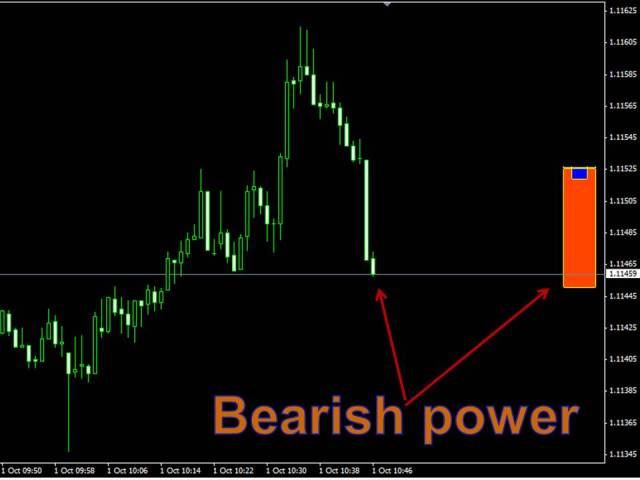
Watch as the red zone is wide and powerful and also the progress of the war zone occurs in favor of the motion, the conclusion to be drawn from this is that the downward trend develops smoothly and no turnaround in sight .
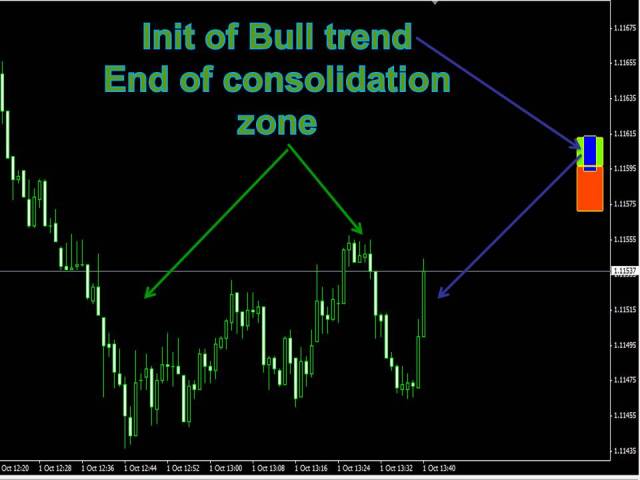
STAGE 3: CONSOLIDATION AND START OF BULL TREND:
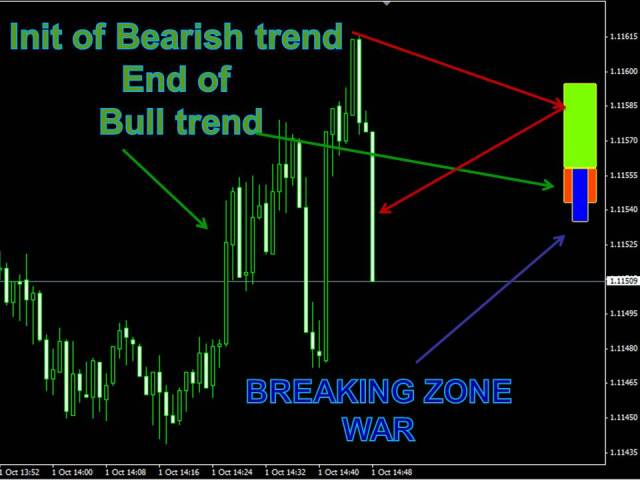
STAGE 4: END OF BULL TREND TREND AND START OF BEAR:
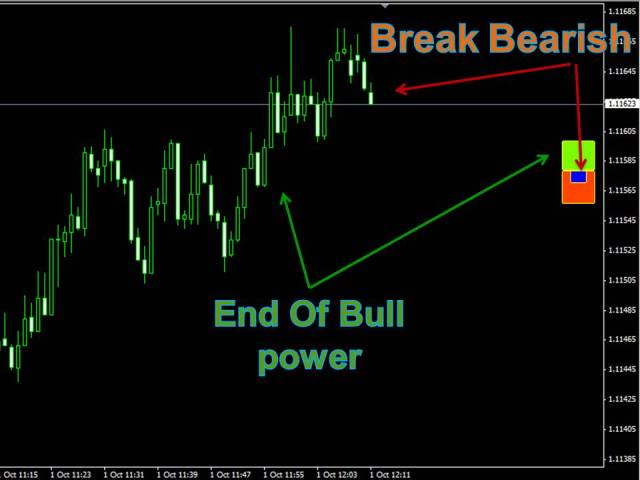
In this scenario, we observed that the uptrend is exhausted because both areas are very tight, and the war zone has opted in favor of the downtrend, reading to do is going to start a downtrend.
STAGE 5: CONSOLIDATION AND START END BULL TREND:
STAGE 6: START OF TREND DOWN:
This time we look. As a powerful uptrend after the war zone it has broken hard and hopefully the start of a downtrend
I hope you like the indicator and hope your comments.
Greeting one.Raul


")
![[XAUUSD]: Weekly Liquidity Activation Points (timings), June 22-26, 2026](https://c.mql5.com/6/1013/splash-preview-771790.png "[XAUUSD]: Weekly Liquidity Activation Points (timings), June 22-26, 2026")
")