Strategy Overview
The strategy was inspired from turtle trading strategies, but is too far removed to be called a turtle trading strategy.
- Currency pair: AUD/USD
- Timeframe: 1-Day
-
Indicators:
- Commodity Channel Index (CCI)
- period: 10
- Minimum/Maximum Ratio
- MIN_MAX_RATIO
- period: 10
- MIN_MAX_RATIO
- Percentage Price Oscillator (PPO)
- PPO
- Fast period: 10
- Fast MA Type: triangular Exponential Moving Average (TRIMA)
- Slow period: 25
- Slow MA Type: triangular Exponential Moving Average (TRIMA)
- PPO
- Rate of Change (ROC)
- ROC
- period: 5
- ROC
- TRIMA Price Difference
- PRICE_MINUS_TRIMA
- period: 10
- PRICE_MINUS_TRIMA
- Commodity Channel Index (CCI)
- Historical data used to build: January 1, 2012 - January 1, 2015
- Historical data used for testing: January 1, 2015 to August 16, 2015
Building Our Strategy
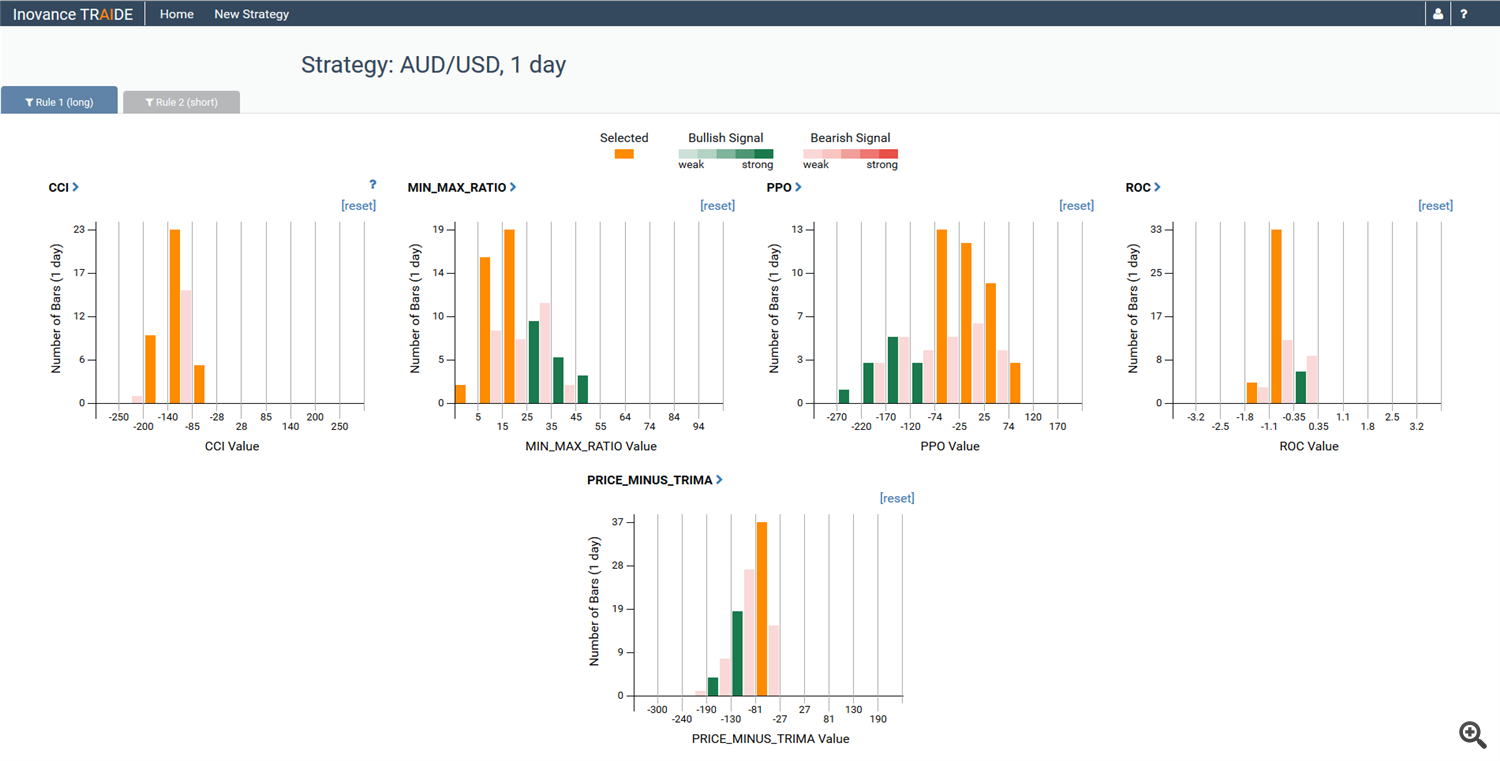
The strategy rules are built on historical data using TRAIDE.
TRAIDE gives us the empirical data (long and short opportunities)
combined with an analysis done with an ensemble of machine-learning
algorithms.
Strategy Rules:
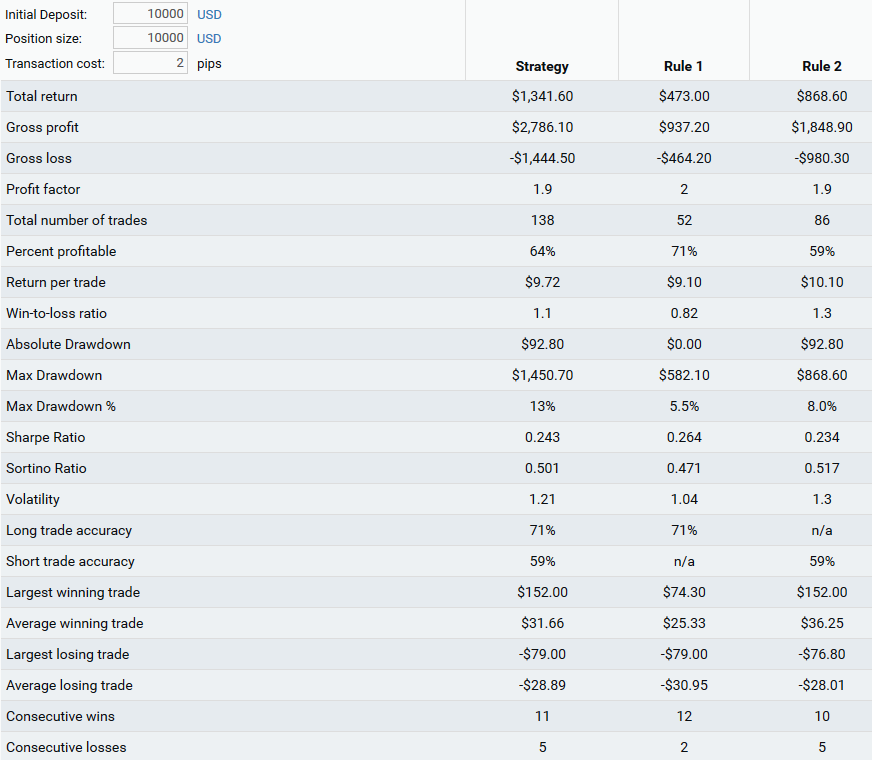
In TRAIDE, our strategy returned 13% including 2 pips per trade for
transaction costs (spread + commissions). It entered 138 trades and was
profitable 64% of the time from January 1, 2012 to January 1, 2015. It
had an average return per trade of $9.72 and a position size of $10,000
(0.1 lots).

Final Strategy Results: Unseen Data
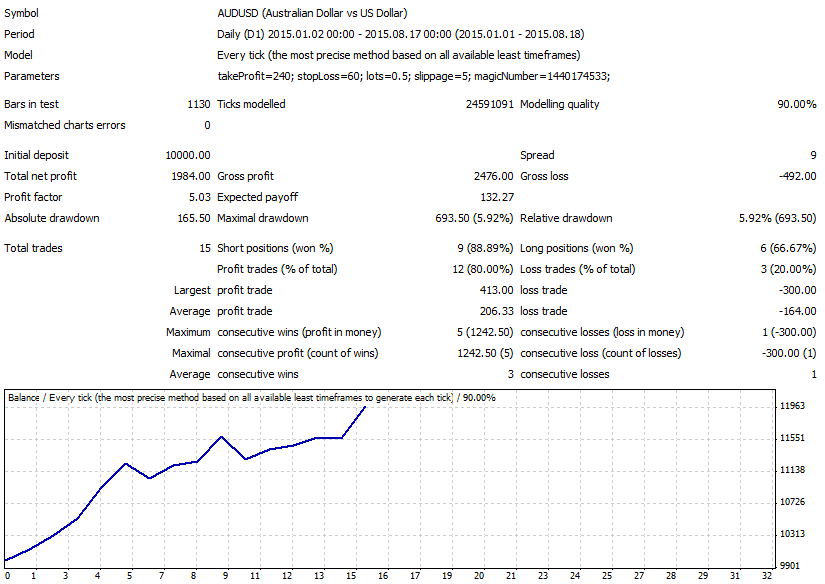
To get the results that gave me the confidence to trade this strategy live, I tested it on unseen, or out-of-sample, data in MetaTrader 4 (90% modelling quality; FXCM 1-minute data). Click here to see the full report.
- Initial Deposit: $10,000
- Trade Size: 0.5 Lots
- Number of trades: 15
- Trading costs: .9 pip (set to 9 for 5-digit brokers in MT4)
- Net profit: 19.84% ($1,984.00)
- Drawdown: 5.92%
- Date range: January 1, 2015 to August 16, 2015
- Risk-to-reward ratio: 4:1 (240 pip take profit and 60 pip stop loss)
- Average win: $206.33
- Average loss: -$164.00

Summary
We selected the data we wanted TRAIDE to analyze; the indicators, currency pair, timeframe, and date range. We then had TRAIDE’s machine-learning algorithms analyze the relationships in our data by clicking “Run”. We are then presented with the information TRAIDE uncovered and we selected the rules where we wanted to go long or short by selected histogram bins. After creating our rules, we exported our strategy to MetaTrader 4 where we tested our strategy on out-of-sample data. The strategy performed well and we were able to enhance it by adding a take profit and stop loss. Now that we are confident in our strategy and testing method, we can now trade this strategy on live rates.


