
Quick Technical Overview - CAC 40 Index: possible breakdown for correction

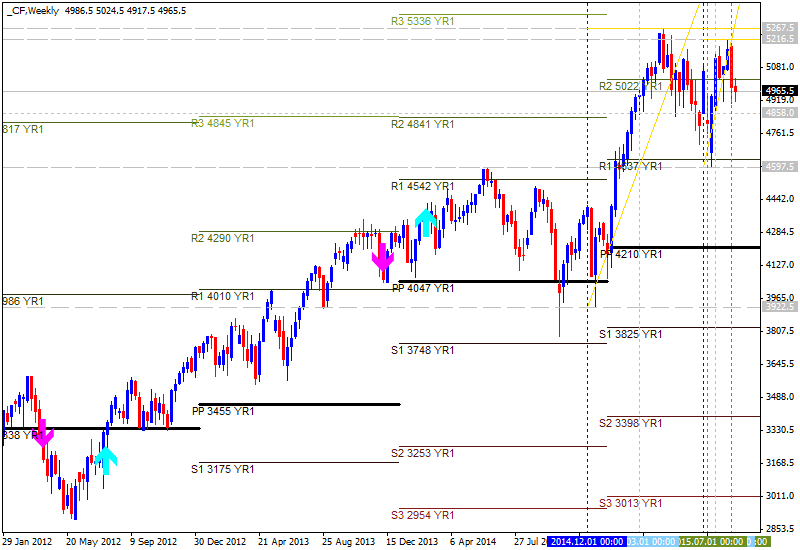
Weekly price for CAC 40 Index (French stock market index) is on bullish for the secondary ranging market condition. Price is located between 5267.5 key resistance level and 4597.5 key support level.
The price was on strong bullish condition since January this year till the middle of April this year, with ranging condition to be started since end of April till now. Intermediate support level for CAC 40 is 4858.0 which is the border between the secondary ranging and the secondary correction: if the price breaks this level from above to below so the local downtrend as the correction will be started up to the key support level (4597.5). If the price breaks 4597.5 key support - we may see the reversal to the primary bearish.
- Chinkou Span line is located to be above the price and indicating the future possible breakdown for correction.
- 'Reversal' Senkou Span A line (which is the virtual border between the primary bullish and the primary bearish on the chart) is located near 4597.5 key support which makes bearish reversal to be possible in the near future.
- Tenkan-sen crossed Kijun-sen line for correction to be started.
- The nearest support level is 4858.0, and the next level is 4597.5.
- Absolute Strength indicator is estimating the secondary ranging.
- Pivot Points (yearly PP on weekly chart): the price is ranging between R1 Pivot at 4637 and R3 Pivot at 5404.
| Instrument | S1 Pivot | Yearly PP | R1 Pivot | R2 Pivot | R3 Pivot |
|---|---|---|---|---|---|
| CAC 40 |
3825 |
4210 |
4637 | 5022 | 5404 |

If W1 price will break support level at 4858.0 on close W1 bar so the secondary correction within the primary bullish will be started.
If W1 price will break support level at 4597.5 so the trend will be
reversed to the primary bearish condition.
If W1 price will break resistance level at 5267.5 so the bullish trend will be
continuing up to the 'new top' as the new resistance level as the key target.
If not so the price will be ranging between the levels.
Trend:


")
![[XAUUSD]: Weekly Liquidity Activation Points (timings), June 22-26, 2026](https://c.mql5.com/6/1013/splash-preview-771790.png "[XAUUSD]: Weekly Liquidity Activation Points (timings), June 22-26, 2026")
")