

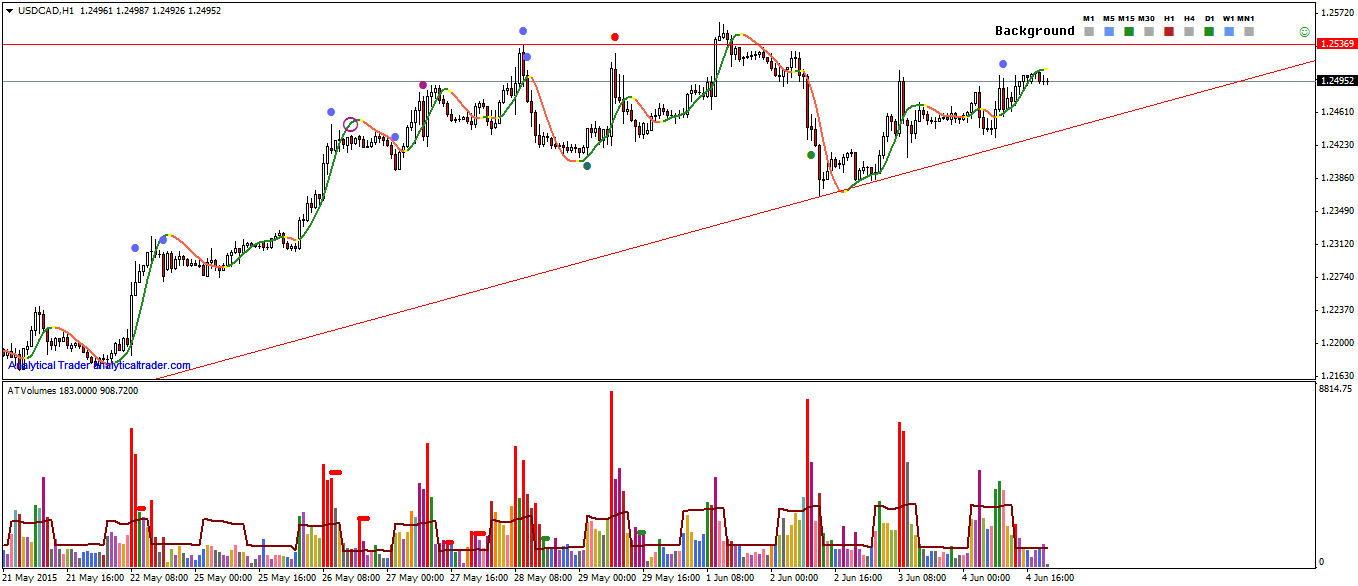
This pair has been showing significant supply at 1.25 and up, with no previous resistance, which means it isn’t overhead supply (which is usually not something to worry about). The most significant resistance is at 1.25369, which is the high of the previous supply bars. There is a trendline coming from almost the beginning of this rally, since 12th May, which is the level to watch for an eventual short trade.
There is a high chance there will be a fake break-out, in order to get more longs trapped and to catch the stop-losses of shorts, which would confirm that this is in fact distribution. This would be a break-out with either low volume, or a break-out with supply signal right above the resistance after it was broken. To the downside, a break-out of the trendline with good volume would be a trend change signal, if the background keeps at being weak, and given the weakness behind. At the moment the pair is making successive higher lows, which means that for now the prices are being supported, and the dynamic trend is giving the same indication as it’s still up.
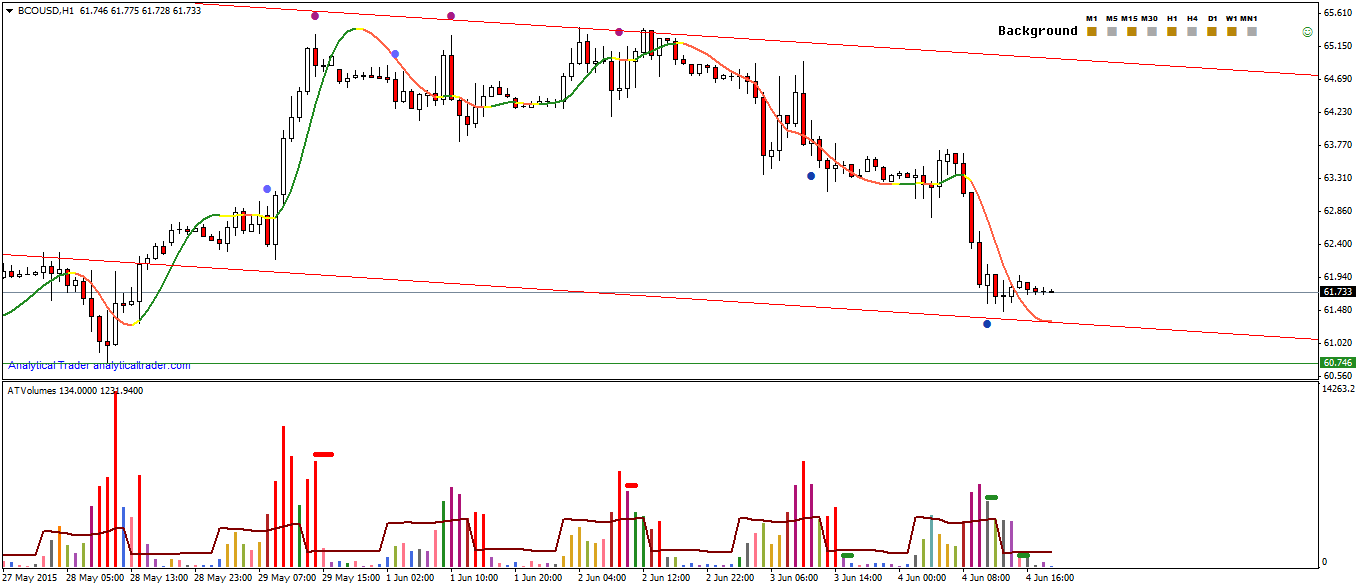
Brent crude oil, which is related to the Canadian Dollar, as Canada is a big oil exporter, is on the lower part of the trend channel, and recently showed a demand signal, at a previous strength area. It’s not showing the sideways movement as USDCAD is though, so I’m waiting for prices to stabilize at this level or to make a higher low, and for the background to change to strong.


")