

Litecoin opened up a bearish outlook toward the 2014-low of 2.21 when it
broke below a support pivot at 6.66. Since then, price has been
“chewing” down the tail from the July 1st spike down. The trend looks
bearish in the daily, 4H ,1H, down to the 15-minute chart, based on the
moving averages, and the RSIs in the these time-frames.
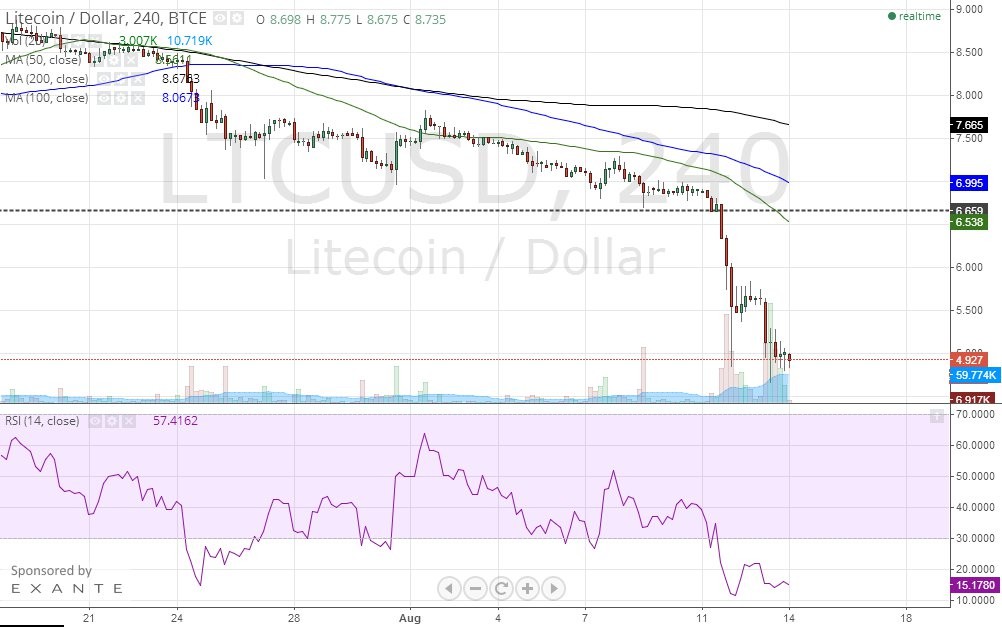
In the 4H chart, you can see that price has fallen sharply over the past 2 sessions, but there has been no signs of stopping except for a bit of bullish divergence between price and the RSI. However, volume during the dips has been strong, so we can not rely solely on the bullish divergence to consider a consolidation or pullback.
Litecoin 4H chart
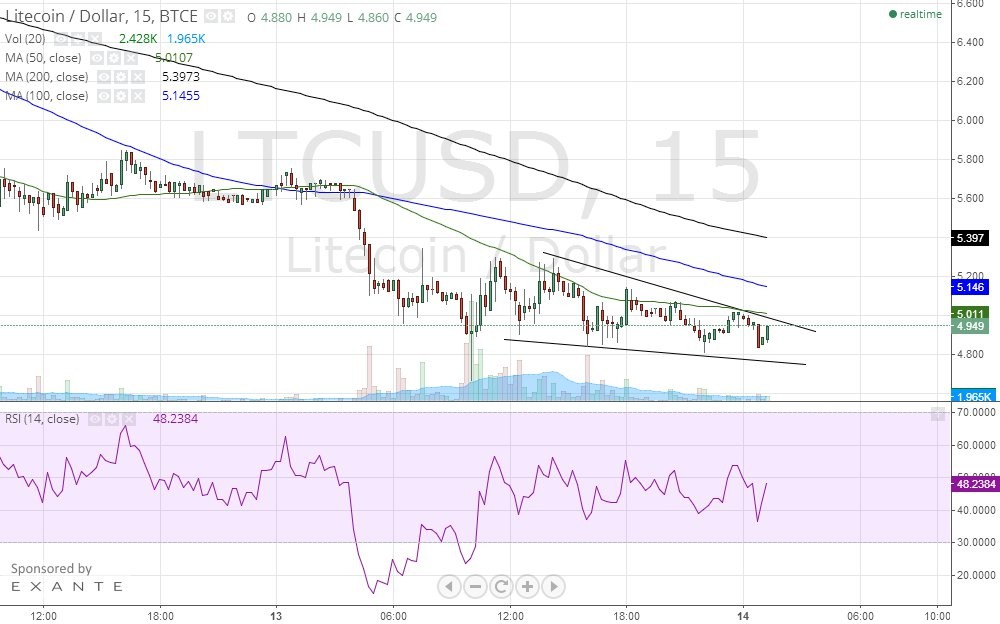
If litecoin price can rally above 5.00 it would break above the falling wedge, as well as the 50-period SMA in the 15-min chart. If then, price can start treating the 4.90-5.0 area as support, we can start considering a bullish correction or consolidation in the short-term.
In the 4H chart, you can see that price has fallen sharply over the past 2 sessions, but there has been no signs of stopping except for a bit of bullish divergence between price and the RSI. However, volume during the dips has been strong, so we can not rely solely on the bullish divergence to consider a consolidation or pullback.
Litecoin 4H chart
If litecoin price can rally above 5.00 it would break above the falling wedge, as well as the 50-period SMA in the 15-min chart. If then, price can start treating the 4.90-5.0 area as support, we can start considering a bullish correction or consolidation in the short-term.
Litecoin 15 min Chart
If we do get a pullback, we should monitor that 6.66 level as
resistance. If price stays below 7.0, the bearish outlook is still valid
for the short to medium term, with downside risk toward 2.21.


![[Two Different Approaches to Market Timing]: The Spiral Calendar and the VISTmany Research Project](https://c.mql5.com/6/1012/splash-preview-771691.png "[Two Different Approaches to Market Timing]: The Spiral Calendar and the VISTmany Research Project")

