

The concept of The Forex Fractal is more than just a strategy idea. It was first explained to me in depth by top trader and CTA (Commodities Trading Advisor) Chris Lori. If you find what follows interesting, I definitely recommend the study of Chris’s materials.
“A geometric pattern that is repeated at ever smaller scales to produce irregular shapes and surfaces that cannot be represented by classical geometry“
The fractal as used here refers to areas of pricechannelling and consolidation that are being watched by large numbers of forex traders. More importantly, the boundaries of those channels are being watched by the Big Guns in the market, thus forming levels of support andresistance.
The dictionary definition of fractal is “A geometric pattern that is repeated at ever smaller scales to produce irregular shapes and surfaces that cannot be represented by classical geometry”.
As in Fibonacci sequences, it’s a fact in nature, art and also trading, that patterns repeat. Pick a pattern on a five-minute forex chart and you will find the same pattern repeating on higher timeframes, very often “nesting” within the same timespan on the higher timeframes.
At this stage you might be asking what is the difference between a fractal and a simpleprice channel? The two distinguishing features I see are:
1) It’s simple enough to identify a single price channel on a chart, but once you start stacking fractals on top of one another you begin to see that price is actually fracturing or ‘fractalling’ along a trajectory, either bullish or bearish. This is far more powerful information, as it gives an indication of
- the Trend, and
- how far price, when it breaks out from a fractal, might surge before it withdraws back into the body of the fractal. For example, if the fractals are each averaging about 50 pips from the lower edge to the top edge, then if price surges through in either direction we could expect that it would not go much further than 50 pips to begin with. This enables us to set stops and take profits with a little more certainty.
2) Once you study the fundamental aspects behind the construction of price fractals, you see the market and its price action dynamics with far more clarity. The fundamentals of fractal price action are tied up in the order flows coming out of major financial centres: the banks and trading houses and other major players.
So how can we use this information, and how does it appear on our forex charts? The two charts below attempt to give an explanation.
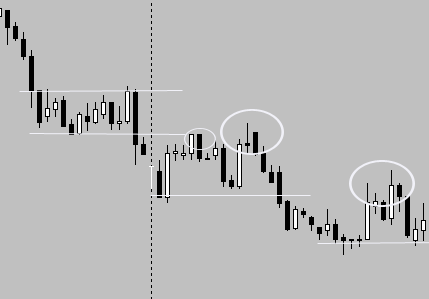
The first example shows price in a down trend. I have identified three fractals on this chart, indicated by the horizontal white lines.
After price had plunged at the left of the chart it formed a holding pattern and tracked sideways.
There are many fundamental reasons for this – and again I recommend Chris Lori for further information, as the subject is so broad and the detail intense that it cannot be covered in this (comparatively) short article – but what has happened is that sellers have withdrawn from the market and price has therefore stabilised.
After this first fractal formed price slipped through at the end of the session, indicated by the vertical dotted line. This is quite common price behaviour at session change-over times: traders exiting the market settle up their positions, which in this case has resulted in more longs withdrawing and a resulting drop in price.
A small gap down followed at the start of the new session and price found a new level of support at the third white line drawn.
Note the resistance formed by the underneath of the previous fractal. This old area of support now signifies an area where sellers are lined up, and as price approaches that area it twice rejects, see the two white circles in the middle of the chart. Depending on all the other usual factors that you should take into account in your trading (time of day, confluence etc.) either of these rejections represented a possible short entry.
The final circle at the right shows where price has come back and pierced the second fractal, but not managed to stay within it. The underneath of the second fractal now becomes the area of resistance where traders are prepared to enter with short orders. Their order flows concentrate around the boundaries of this fractal and the new one now forming.
Essentially, what happens as fractals form in a trend is that the order flows created by major market players adjust to a new bandwidth or price extent. The big traders, for one reason or another, will be trading the currency pair between those two levels represented by the top and bottom of the fractal, until external factors such as breaking news cause price to move beyond the limits of the current fractal.
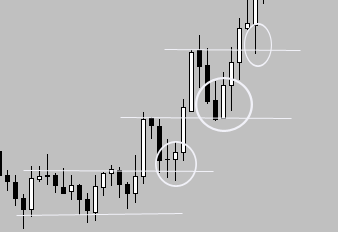
The second chart shows price forming fractals in an uptrend.
By now I hope you can see how easy it is to draw in the lines representing the upper and lower boundaries of a fractal.
You don’t have to do this physically on your charts of course; in time it just becomes automatic for you to see these levels and to note them.
The first circle marks where price after breaking out of the first fractal (and, interestingly, surging a distance roughly equal to the bandwidth of the previous fractal, plus just a little more) retraces and rejects from the upper level of the fractal it just broke out of.
The last two circles shows similar retests as price moves into an increasingly bullish trend. As the move upwards gains momentum the bandwidth of each successive fractal extends a little.
There are two main ways to trade the fractal: the Slip Through and the Retest. Briefly, the details of these two approaches are:
- For the Slip Through, wait for a strong, preferably blunt-ended candle to close beyond the boundary of the current fractal. Place a limit order just in front of price, with a stop just behind the other boundary of the fractal. This gives you a stoploss of the width of the fractal, and that is usually a good place for your stop to go.
- For the Retest, wait until price surges beyond a fractal boundary (in other words, a Slip Through) and returns to retest the fractal boundary it just broke beyond. Ensure that it rejects from this level in the direction that it took when it surged beyond the fractal. Once more, place your stop on the other side of the fractal, i.e. beyond the furthest fractal boundary.
As always in every strategy, be sure to incorporate other signals and information into your trading decisions. Trading the boundaries of the fractal is the core of the strategy only.
A few last notes:
- I have left discussion of the forex fractal to be the final of the 10 forex strategies presented in this section of AuthenticFX. There were several reasons for this, not the least being the fact that the fractal is a difficult concept, on some levels, to teach. If I have left anything poorly explained, or if you would like more details, please leave questions and/or feedback below. The dynamics of forex fractals are fundamental to the way I trade, so I’d love to hear your thoughts on this!
- Also, if you’ve read through the other nine strategies you maybe now can see that the power of each individual strategy comes from its ability to be combined with some or all of the others into a comprehensive suite of strategies to be traded within a forex system.
Trading fractals is something I continue to find fascinating and rewarding. If you apply yourself to studying it, I guarantee positive results will show in your trading!


