
Trading Strategies: Breakout With Three-Step Market Mechanics

Traders love breakouts and breakdowns, but profit strategies that take full advantage of these market phenomena can take a lifetime to master. The trouble starts when we forget our game, fixate on the emotional crowd and react to their excitement or fear. A better plan is to internalize the three-step mechanics at work when a security breaks a support or resistance level, as well as the repeating patterns in play when rising or falling prices progress from one level of activity to the next.
A typical breakout or breakdown unfolds in three distinct phases: action, reaction and resolution. These specialized impulses are at work in all time frames, from intraday range swings, up to investment-scale breakouts that can book a lifetime of profits. Better yet, each phase generates specific trading strategies that capitalize on crowd behavior at that moment in price development, allowing versatile market players to pick up a breakout or breakdown in progress and take risk in alignment with short-term dynamics.
This technical discovery mechanism works equally well in up and down markets, as well as from the long and short sides. Better yet, it has profitable applications in all sorts of range expansion scenarios beyond the movement of price above or below horizontal support or resistance. For example, the three phases are hard at work when a security tests intermediate and long-term moving averages, like the 50- and 200-day EMAs. They also organize the testing process when price gaps higher or lower and pulses against boundaries, before taking off in a continuation wave or turning back on itself and filling the gap.
Theory and Practice
Breakouts and breakdowns begin with an action impulse that carries price above or below a support or resistance level, like a horizontal high or a trendline. This is often an emotionally charged period, with traders jumping over each other to get positioned. The trend wave evolves, stretching away from the prior barrier, and then stalls, printing a notable high (low in a breakdown) and entering a reaction impulse. This marks the testing period, often characterized by pullbacks to new support or resistance. It can also signal the onset of whipsaws that force traders and investors out of positions they had no intentions of exiting. Price action eventually completes a consolidation pattern, yielding one of two outcomes. Either it pushes beyond the action impulse high or low swing, confirming the new trend, or the trend fails, yielding a reversal that traps trend followers. In both cases, this marks the resolution impulse.
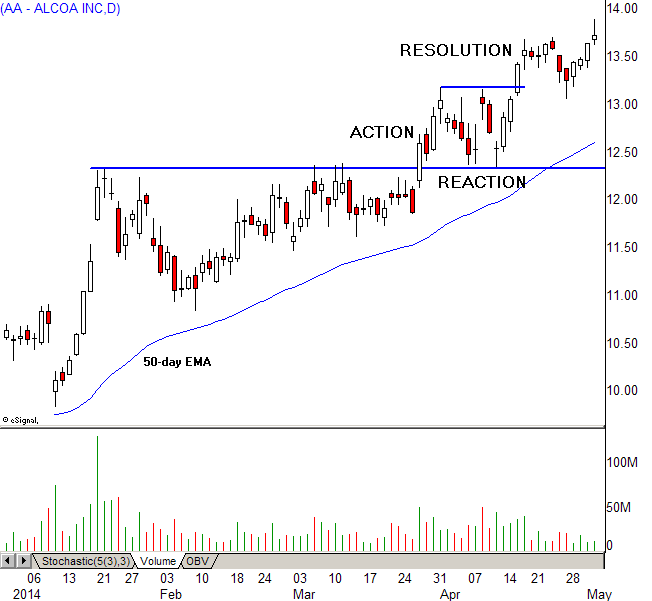
Alcoa rallies to 12.40 in January and carves out an ascending triangle pattern. It tests resistance for more than two months and breaks out in late March, in an action impulse that stalls above 13. The stock then enters the reaction impulse, grinding sideways in a rectangle pattern right on top of new support. The new floor holds and price ejects in the resolution impulse, climbing above the prior high and confirming the new uptrend.
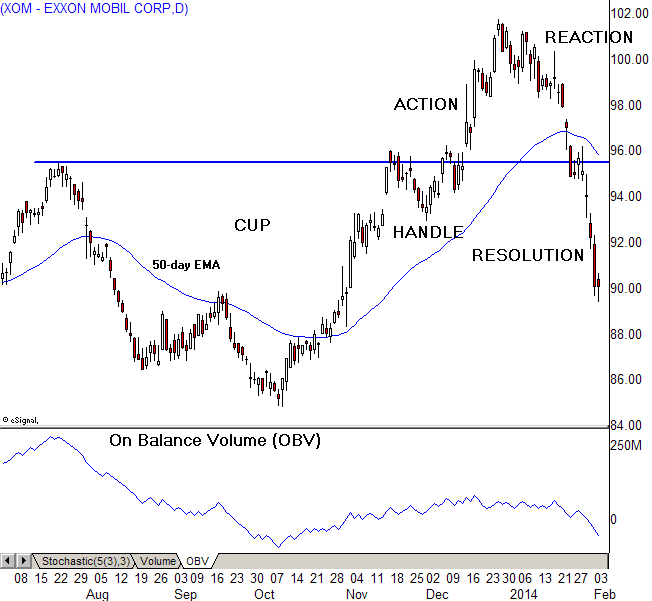
Exxon-Mobil carves out a five-month cup and handle pattern with resistance at 96 and breaks out in December, signaling an action impulse. It climbs above 100 and tops out, yielding a reaction impulse that drops into new support, now fortified by the 50-day EMA. The stock gaps through that level, triggering a failed breakout characteristic of resolution impulses that go badly for trend followers. Note how accumulation as measured by On Balance Volume doesn’t move higher with price, generating a notable bearish divergence. This is a common characteristic in resolution failure swings.
Trading Strategies
Each impulse of the action-reaction-resolution cycle supports narrowly tailored trading strategies. Play the breakout when price pushes above resistance or the breakdown when it fails support. Or take a narrow range entry, entering in low volatility before the move occurs and placing a tight stop, getting out for a small loss if proved wrong. Either way, take profits aggressively after the trend wave gets underway to avoid holding through the reaction impulse. A trailing stop works very well in these conditions, locking in profits by raising or lowering it as the security swings in your direction.
Buy the dip or sell the rip during reaction impulses when price pulls back to new support or resistance. Or wait for a minor failure, like a violation of the breakout level that comes into stronger support at the 50-day EMA. Buy at this deeper level while breakout traders get shaken out or wait until price reemerges above broken support and take the upturn as your buy signal. Just keep in mind the reaction impulse tends to last longer than the action or resolution impulses and taking risk too early can generate unfavorable opportunity cost.
Shift to a momentum strategy when the resolution impulse sets into motion, buying high and selling higher or selling short low and covering lower. This impulse tends to elicit the most favorable price rate of change of the three impulses. This happens because trend confirmation or pattern failure signals go off across a variety of platforms, generating fresh rounds of trading activity that translate into rapid price movement.
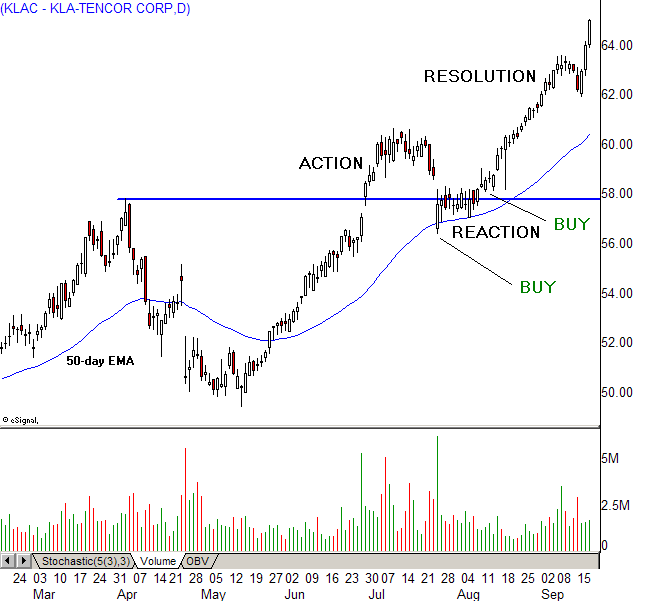
KLA-Tencor illustrates a pullback trade that uses the crowd’s pain as rally fuel. It enters an action impulse, breaking above three-month resistance at 58 and trading up to 61. The reaction impulse then kicks into gear, building a three-week sideways pattern, followed by a gap that drops price into the 50-day EMA after cutting through new support. Breakout traders are forced to book losses on the gap, which also attracts short sellers, while observant traders recognize the opportunity and go long, with stop losses below the gap down bar. The stock tests the moving average for two weeks and jumps above the original breakout level, in a secondary buy signal that triggers a resolution impulse and new high.
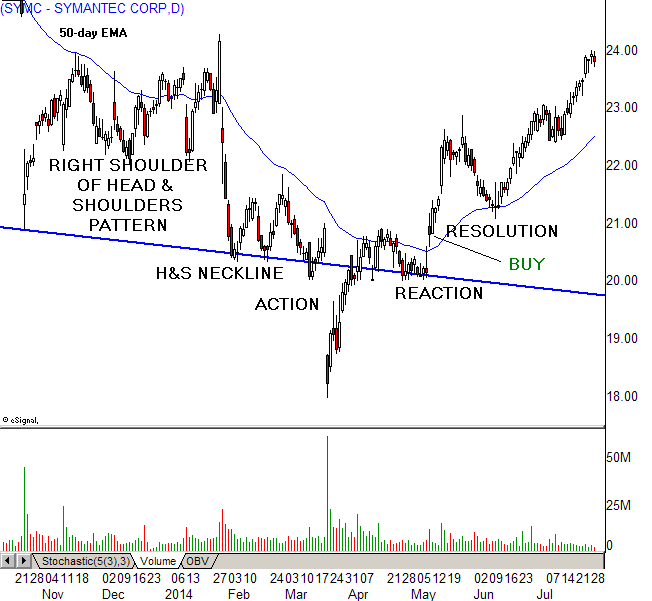
Symantec (SYMC) shows a failed breakdown trade that relies on short sellers getting too aggressive with the well-known head and shoulder pattern. Price descends to the neckline in February, bounces along its edges for over a month and gaps down on high volume, entering an action impulse that triggers all sorts of sell short signals. That selloff bar marks the swing low, ahead of a two-week bounce that lifts price above the neckline but below the 50-day EMA. The reaction impulse continues for another six weeks while price hugs the underside of the moving average. The May rally triggers a buy signal and the resolution impulse, which gains momentum from trapped short sellers forced to cover positions.


")