Every trader knows that the market is a periodic entity. It is not surprising. Weeks, days, sessions start over and over again by a global schedule. Montly reports, seasonal changes, and most other things happen regularly. And even the quotes themselves are organized into a series of uniform bars. So periodicity is obvious. Why not to use it for trading? And indeed, it's used. One of the first examples that may come into mind is the weekend gap trading - it utilizes the fact that, on the Forex, Friday evening rates and Monday morning rates are usually splitted by a noticable jump in prices which tends to be rolled back. Morning flat (that is european morning flat) breakout is another well-known strategy based on trading sessions regularity. But of course there are many more tradable regularities in the market. Today I'll present you 2 tools which may help you to discover such opportunities.
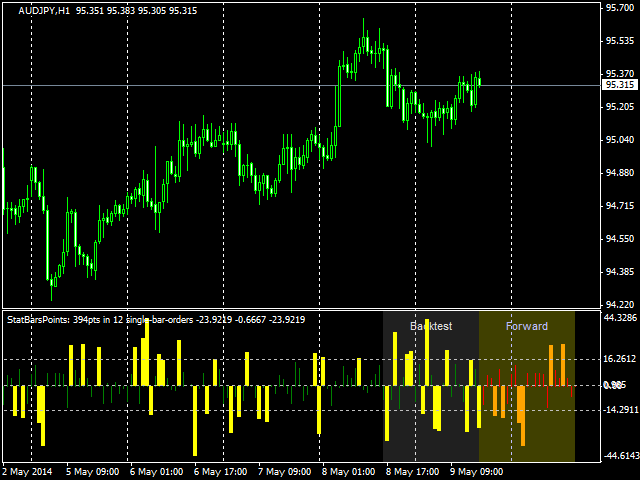
The first one is intended for intraday trading. This is StatBars indicator that gathers and visualizes statistics of price movements for intraday bars. Basically, it shows a histogram of average price movements for every specific bar in history (for example, at 11-th, 12-th, 13-th, etc. hour of H1 timeframe), separately for each day of week.

Most important thing about this indicator is its prediction ability. Thanks to the statistics, you know beforehand how next bars are going to evolve (most likely). Of course, this is just statistics, not a 100% accurate picture of the future, but this is also a generalized representation of the same old regularities which have previously been sought and crystallized by traders manually. And now you'll get it in a blink.
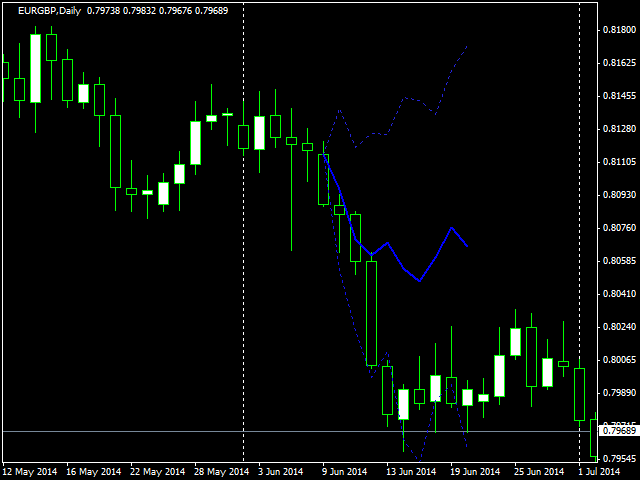
Another story is a long-term trading, when larger timeframes are used, such as D1. For this strategy it seems logical to analyze regularities on a year-by-year basis. This is exactly what the second tool of the overview does: indicator Year2Year inspects past years' quotes on the same days as the current day, and calculates future characteristic price movement as an average.

In addition to the average, indicator shows variation, which allows you to estimate how consistent the observed behaviour was over years. If the variation is small, price movements were similar on those days in past, and one can expect to see this again, and trade accordingly. Also you may place limit orders on the variation's upper and lower boundaries.
Of course, both of the indicators can be used not only on the Forex, but other markets as well. You may find more details about these tools on their dedicated pages.


