

The Head and Shoulders Chart Pattern is the easiest to recognize patterns. It’s classically known as a Reversal Top Pattern, though the less common “Inverted” Head and Shoulders Pattern is known as a Bottom Reversal Pattern.
How to Trade a Head and Shoulders
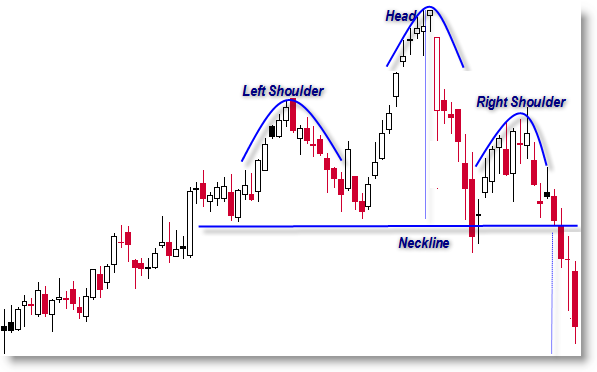
Once you see the three swings that comprise a H&S pattern, you can sell-short once price trades beneath the “Neckline” support level and place a stop above the swing high of the Right Shoulder.
What’s interesting about the H&S pattern is that it has a built-in “Measuring Objective” or “Price Projection Target” when price breaks beneath the support line of the neck. Traditionally, we would measure the distance from the Head to the Neckline and then take this distance and subtract it from the Neckline once price breaks below it for a Price Objective.
If the Head peaks at $100 and the Neckline is established at $80, then once the price breaks below the Neckline out of the Right Shoulder, we would then subtract $20 (the distance from the Head to the Neckline) from $80 (the Neckline) to give us a price projection target of $60. The blue dotted vertical lines represent the Measuring Objective on the chart above.


 & AMD Framework")
