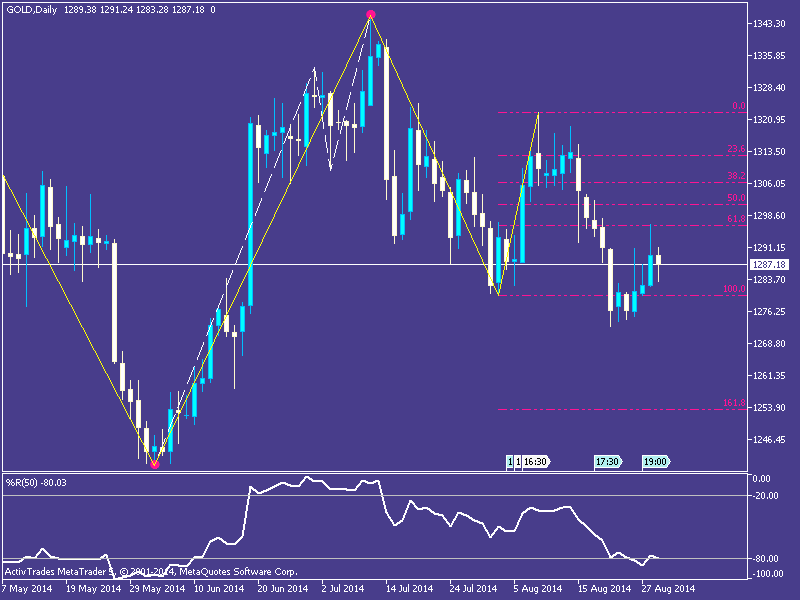
The Gold Daily chart shows a pull-back on the secondary bearish trend.
The red dot on the last maximum indicates that probably we will see soon a new minimum that I estimate on 161.8 Fibonacci dynamic low level (1253).
Good luck!

The Gold Daily chart shows a pull-back on the secondary bearish trend.
The red dot on the last maximum indicates that probably we will see soon a new minimum that I estimate on 161.8 Fibonacci dynamic low level (1253).
Good luck!
