

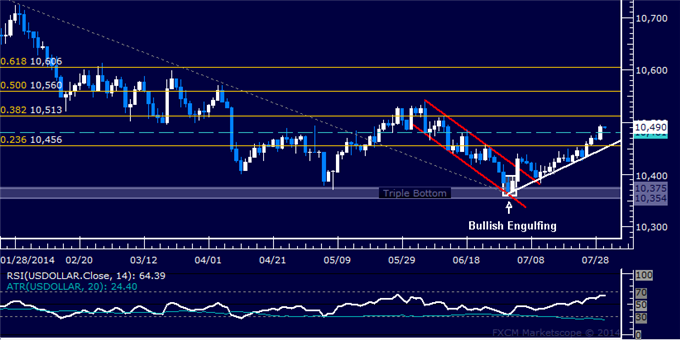
- Support: 10481, 10456, 10375
- Resistance:10513, 10560, 10606
US Dollar Index broke above yet another layer of resistance after reversing upward as expected having put in a Bullish Engulfing candle pattern. Near-term resistance is at 10513, the 38.2% Fibonacci retracement. A daily close above that exposes 50% level at 10560. Alternatively, a turn back below horizontal pivot support at 10481 opens clears the way for a test of 10456, the intersection of the 23.6% Fib and a rising trend line set from the July 1 low.


")

![[XAUUSD]: Weekly Liquidity Activation Points (timings), June 22-26, 2026](https://c.mql5.com/6/1013/splash-preview-771790.png "[XAUUSD]: Weekly Liquidity Activation Points (timings), June 22-26, 2026")