
Technical Price Pattern Analysis for EURUSD, GBPUSD, AUDUSD, NZDUSD, USDJPY, USDCAD and USDCHF
3 November 2014, 03:11

0
384
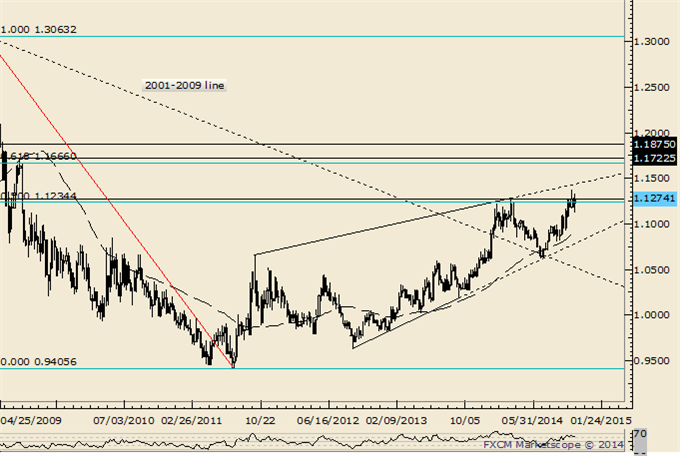
EUR/USD
Weekly
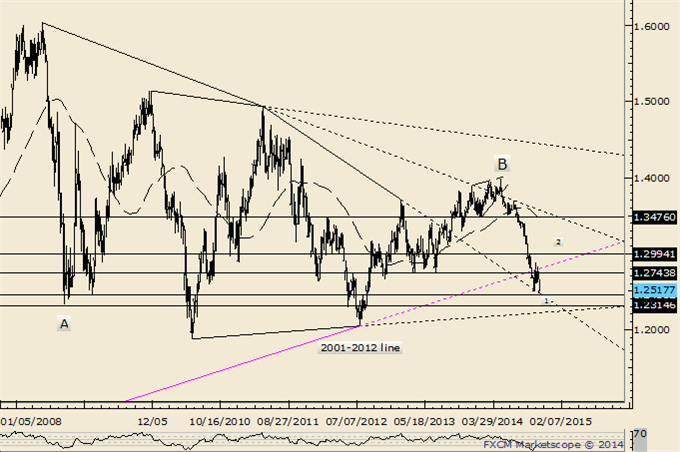
- BIG picture, monthly RSI has broken out of a triangle pattern. Sometimes, a pattern breakout in momentum (or OBV) precedes the breakout in price. The development’s implications are obviously significant.
- “Near term, price action since the October low likely composes a 4th wave correction within a 5 wave decline from the May high. Allow for additional sideways trading in order to complete wave 4 before a new low in wave 5 targets 1.2400 or 1.2315.
GBP/USD
Weekly
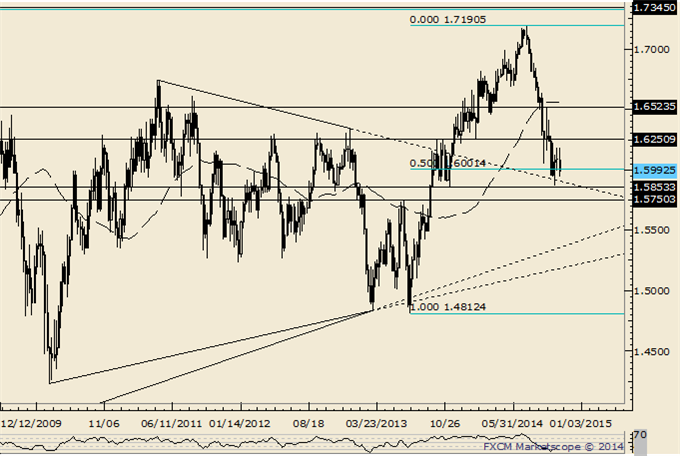
- “GBPUSD is at a crossroads. The trend is down against 1.6184 but recent
activity warns of a turn. The rate carved a key reversal last week and
action since the low is constructive (decline from 1.6184 found low at
the 61.8% of prior rally). Exceeding 1.6184 would confirm a 3 week
bottoming pattern and yield an objective near 1.65.”
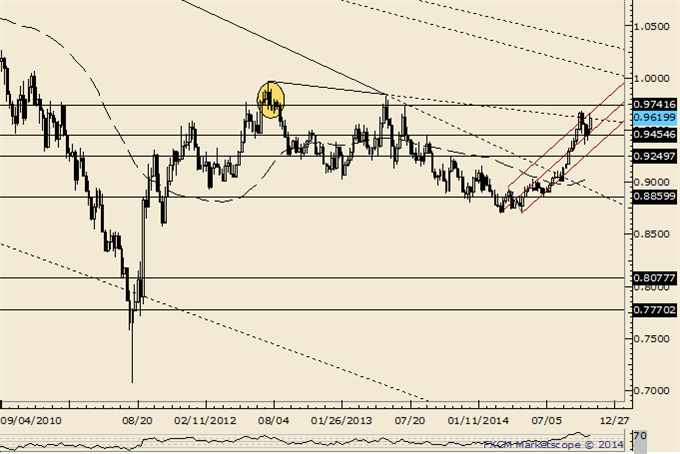
AUD/USD
Weekly
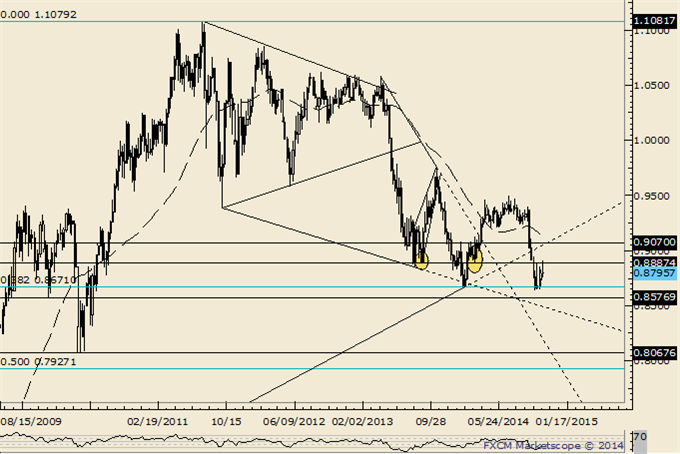
- “The combination of the .9400 figure and weekly RSI failing near 60 indicates a lot of overhead to punch through. Since the 2011 top, each RSI failure near 60 has led to a top or topping process (range for several weeks then a breakdown...that may be the case now).”
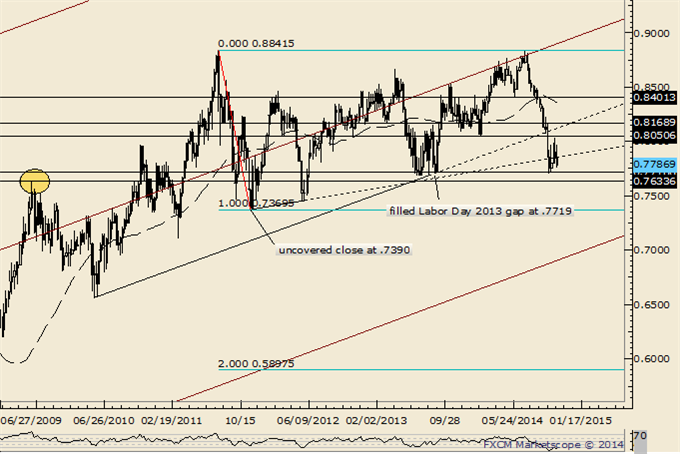
NZD/USD
Weekly
- “Don’t forget about the line that extends off of the 1996 and 2007 highs. That line crosses through the 2008, 2011, and highs as well. In 2011 (record free float high), the rate surged through the line in late July before topping on August 1st. The rate reversed this week from pips below the record high and above the mentioned line.”
- “The gap from Labor Day 2013 has held as support but last week’s spike into .8034 (just shy of the February low at .8050) probably completed 3 weeks of consolidation. In other words, start looking lower again. Ultimately, weakness below .7370 would confirm a double top with an objective of .5898.”
USD/JPY
Monthly
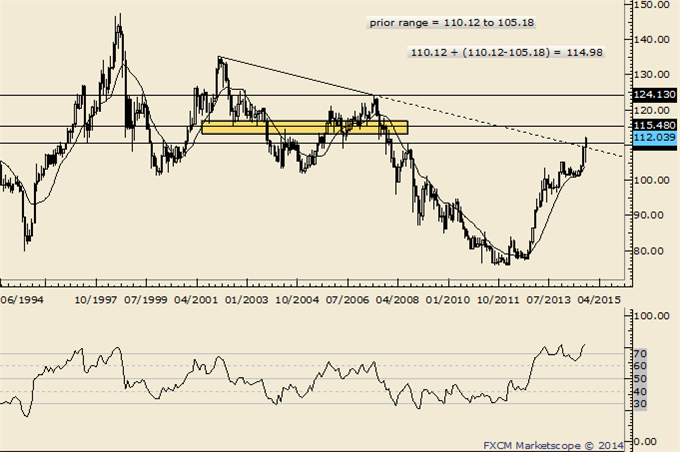
- In fact, the all-time low was exactly 3 years ago today. Where to now? The biggest (and most obvious) level that sticks out is 115.00/50 (range expansion level and inflection points in 2002 and 2007). 113.10 is a possible pausing point (61.8% of prior range added to breakout level).
USD/CAD
Weekly
- “USDCAD traded to its best levels since July 2009 this week but finished in the middle of its range for the week. The close and weak momentum profile casts doubt regarding the validity of the breakout but continue to look higher as long as price is above 1.1080.
USD/CHF
Weekly
- “USDCHF weakness has reset the market for another rally attempt.
Remember, USDCHF broke above the trendline that extends off of the 2001
and 2010 highs. Like EURUSD, USDCHF monthly RSI broke from a potentially
long term basing pattern. As long as .9358 holds, look higher.”


