BB St Dev
- インディケータ
- バージョン: 2.0
- アップデート済み: 22 8月 2018
- アクティベーション: 5

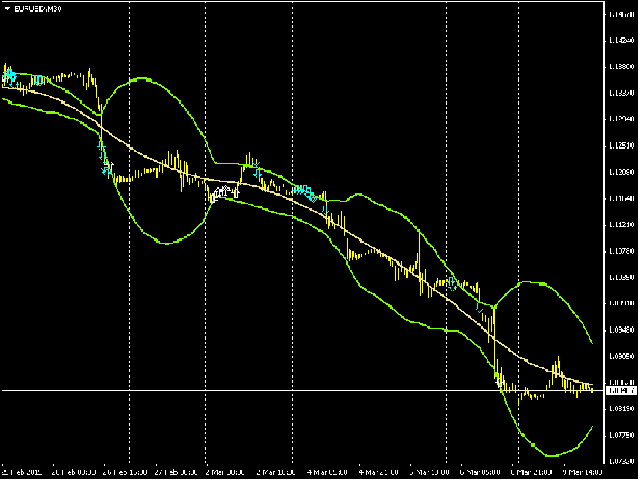
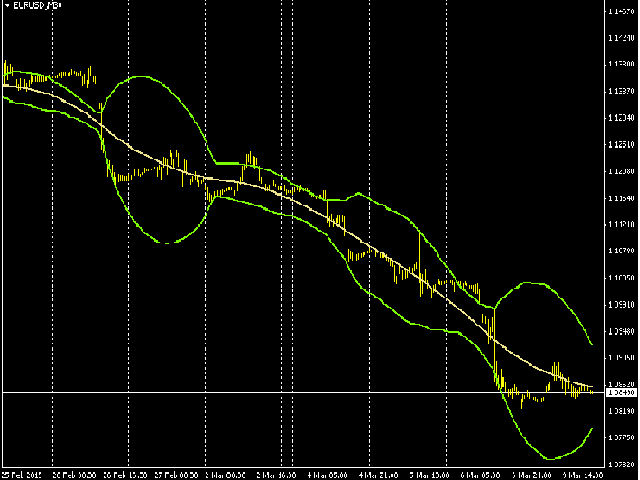
BB St Dev
BB St Dev is analogous to the Bollinger indicator.
Upper and lower parts of the Bollinger channel are calculated by means of iStdDev.
iStdDev is a standard indicator of МetaТrader 4.
Moving average has a special smoothing algorithm.
Settings
- M - period of Moving average
- BandsDeviations parameter - channel generation factor. Apart from classic Bollinger Bands, BandsDeviations can possess any value here.
- Visio parameter
- If Visio = False, this indicator will coincide with the Bollinger Bands indicator.
- If Visio = True, this indicator will show points for possible orders opening.
How to configure this indicator
- Make a choice in: Charts =>Indicators List =>BBand St Dev=>Edit.
- The indicator's window will appear.
- Set parameters.
- Create a template: Charts =>Template =>Save Template.


ユーザーは評価に対して何もコメントを残しませんでした