Heiken Ashi Alerts MT4
- Indikatoren
-
KEENBASE SOFTWARE SOLUTIONS
 Keenbase Trading entwickelt professionelle MetaTrader 4- und MetaTrader 5-Indikatoren sowie Expert Advisors, die Trader dabei unterstützen, fundiertere Handelsentscheidungen zu treffen.
 - Version: 1.0
- Aktivierungen: 5
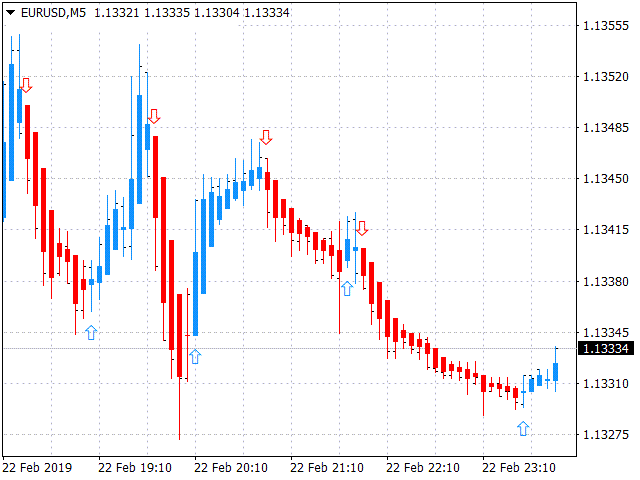
KT Heiken Ashi Alert zeigt Kauf- und Verkaufspfeile basierend auf den Standard-Heiken-Ashi-Kerzen und generiert entsprechende Alarme. Es ist ein unverzichtbares Werkzeug für Trader, die Heiken Ashi in ihre Strategie einbinden möchten.
- Ein Kaufsignal wird angezeigt, wenn Heiken Ashi von einem bärischen zu einem bullischen Zustand wechselt.
- Ein Verkaufssignal wird angezeigt, wenn Heiken Ashi von bullisch auf bärisch wechselt.
- Enthält Benachrichtigungen per Handy, E-Mail, Ton und Pop-up.
Was ist Heiken Ashi genau?
Auf Japanisch bedeutet "Heiken Ashi" so viel wie "durchschnittliche Kerze". Sie wird verwendet, um Kerzendiagramme leichter lesbar zu machen und Trends besser zu erkennen. Heiken Ashi kann sowohl für den Einstieg als auch für den Ausstieg genutzt werden. Eine Farbänderung der Kerze deutet oft auf einen Richtungswechsel hin.
Wichtige Hinweise
- Heiken Ashi Alerts sollte nicht als alleiniger Indikator verwendet werden – kombinieren Sie ihn mit weiteren Tools für präzisere Analysen.
- Ein Trendwechsel beginnt oft mit einer kleinen Kerze mit Dochten auf beiden Seiten.
- Rote Kerzen ohne oberen Docht deuten auf einen starken Abwärtstrend hin.
- Blaue Kerzen ohne unteren Docht deuten auf einen starken Aufwärtstrend hin.
Heiken Ashi Formel
Heiken Ashi Kerzen ähneln den traditionellen japanischen Kerzen, werden jedoch anders berechnet.
- Open = [Open (vorherige Kerze) + Close (vorherige Kerze)] / 2
- Close = (Open + High + Low + Close) / 4
- High = Erreichter Höchstpreis
- Low = Erreichter Tiefstpreis