RedYGreen2
- Indikatoren
- Version: 2.0

Verbesserte Version des einfachen Indikators Trend und Oszillator in den Farben Rot, Gelb und Grün.
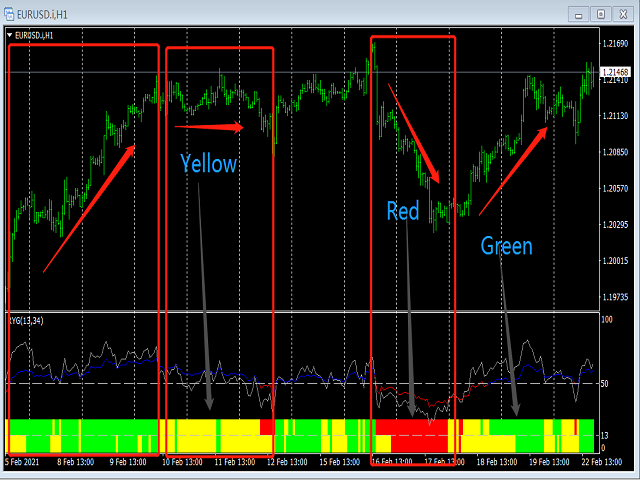
Die Farben Rot, Gelb und Grün werden verwendet, um Aufwärtstrends, Oszillatoren und Abwärtstrends anzuzeigen.
Rot zeigt einen kurzen Trend (abwärts) an.
Grün zeigt einen langen Trend (aufwärts) an.
Gelb zeigt einen Oszillator an.
Ein Wechsel von Gelb zu Rot kann den Markt von einem Oszillator in einen Abwärtstrend verwandeln. Eine durchgehend rote Farbe weist auf einen starken Abwärtstrend hin.
Ein Wechsel von Gelb zu Grün weist auf einen möglichen Wechsel von einem Oszillator zu einem Aufwärtstrend hin. Eine durchgehende grüne Farbe weist auf einen starken Aufwärtstrend hin.
Wenn die obere Hälfte des Indikators und die untere Hälfte des Indikators in roter Farbe synchronisiert sind, deutet dies darauf hin, dass der Abwärtstrend eine Resonanz gebildet hat, und es besteht eine hohe Wahrscheinlichkeit, dass der nächste Abschnitt des kurzen Trends.
Gleichzeitig werden Rot, Grün und Gelb in zwei Teile geteilt:
Wenn die oberen und unteren Teile zur gleichen Zeit für die grüne, was darauf hindeutet, dass der Aufwärtstrend hat eine Resonanz gebildet, die nächste Wahrscheinlichkeit aus einem langen Trend.
Wenn die oberen und unteren Teile zur gleichen Zeit für die rote, was darauf hindeutet, dass der Abwärtstrend hat eine Resonanz gebildet, die nächste Wahrscheinlichkeit aus einem kurzen Trend.
Wenn der obere und untere Teil gleichzeitig gelb sind, zeigt dies an, dass der aktuelle Markt oszilliert.
Aktualisierung 2.0:
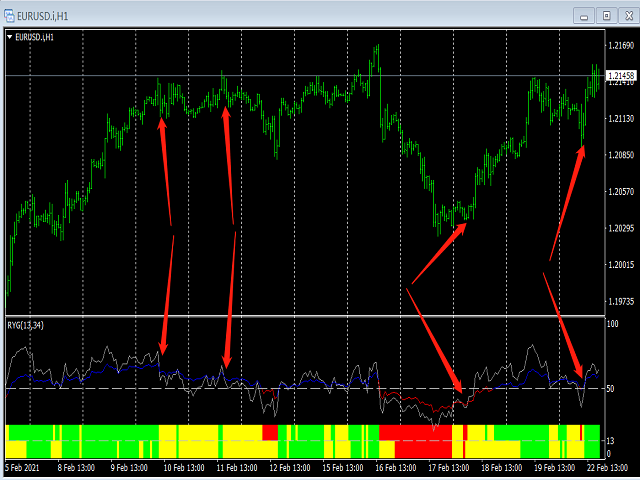
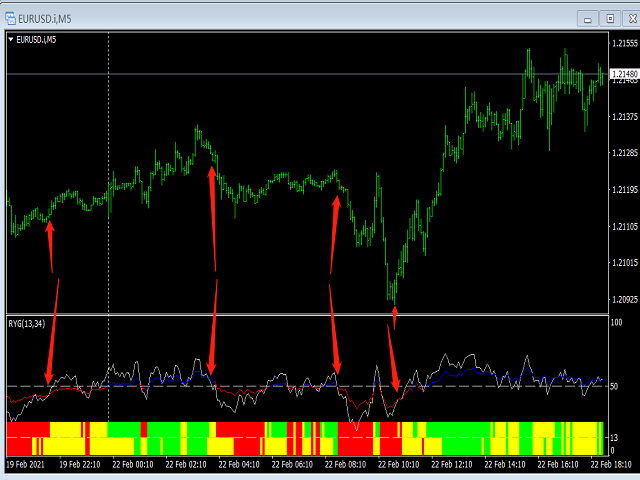
Es wurden zwei neue schnelle und langsame Linien hinzugefügt.
Wenn die langsame Linie (blau/rote Linie) blau ist, gilt der Markt als lang. Wenn die langsame Linie (blau/rote Linie) rot ist, gilt der Markt als short.
Wenn die schnelle Linie (dunkelgraue Linie) die langsame Linie von unten nach oben kreuzt, dient sie als Referenz-Long-Signal für aggressive Händler, um in den Markt einzusteigen und zu kaufen. Und vice versa.
Die Parameter sind einstellbar.
//+-------------------------------------------------------------------------------------------+
Besondere Tipps
Die Marktbedingungen sind unsicher, jeder Indikator basiert auf der Entwicklung des Marktpreises, garantiert nicht die Rentabilität der Verwendung dieses Indikators.