TrendWatch
- Indikatoren
- Version: 2.0
- Aktualisiert: 7 Dezember 2020
- Aktivierungen: 5

Kurzbeschreibung
Der TrendWatch Indikator analysiert die Trendstärke und -beschleunigung im Chart. Die Analyse basiert auf dem Schlusskurs-SMA mit konfigurierbarem Zeitraum. Das Ergebnis wird als eine Reihe von zwei Kurven im Indikatorfenster angezeigt. Die blaue Kurve (Standardfarbe) zeigt die Trendrichtung und -stärke an. Die gelbe Kurve (Standardfarbe) zeigt die Tendenz des Trends zur Beschleunigung/Verlangsamung an. Die Skalierung der Kurven ist auf den Maximalwert im gegebenen Zeitraum normiert. Beide Kurven können zusätzlich mit einem konfigurierbaren SMA geglättet und/oder auf Null gesetzt werden, wenn der absolute Wert unter dem eingestellten Limit liegt (um unbedeutende Werte auszublenden). Roh- und Prozesskurven können gleichzeitig angezeigt werden.
Ver. 2.0 Aktualisierung
Der Divergency-Modus wurde hinzugefügt. Neu können Steigung und Beschleunigung von zwei SMA angezeigt werden. Um den Divergency-Modus zu aktivieren, setzen Sie den Parameter "SMA period for base of divergency" auf die gewünschte Basis-SMA-Periode. Zur Erkennung von Pull-Backs ist "SMA-Periode für Trenderkennung = 10", "SMA-Periode für Basis der Divergenz = 200" eine gute Wahl. Wenn "SMA-Periode für Basis der Divergenz = 0", ist die Funktion deaktiviert.
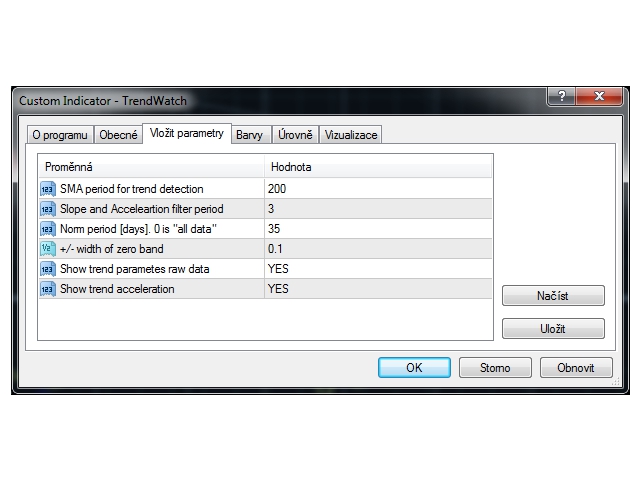
Parameter
- SMA-Periode für die Trenderkennung: Periode des analysierten SMA. Je höher der Wert, desto stabiler der Trend, aber mit höherer Zeitverzögerung und geringerer Empfindlichkeit für schnelle Änderungen. Empfohlener Bereich ist <10, 200>.
- SMA-Periode für die Basis der Divergenz: Periode der SMA-Basis der Abweichung. Bei einem Wert von 0 ist die Funktion deaktiviert. Für jeden anderen positiven Wert zeigt der Indikator die Steigung und die Beschleunigung der Trend-SMA und der Basis-SMA-Differenz an.
- Periode des Steigungsfilters: Steigungskurven-Verarbeitung SMA-Filterperiode. Höherer Wert - glattere Kurve, aber höhere Zeitverzögerung. Empfohlener Bereich ist <2, 25>. WARNUNG! Die Steigungsfilterperiode verursacht auch eine Verschiebung der Beschleunigungskurve.
- Beschleunigungsfilter-Periode: Beschleunigungskurvenverarbeitung SMA-Filterperiode. Höherer Wert - glattere Kurve, aber höhere Zeitverzögerung. Empfohlener Bereich ist <2, 25>.
- Normperiode [Tage]. 0 ist "alle Daten": Zeitintervall (von jetzt an) für die Bewertung von Trend und Trendbeschleunigung/-verzögerung Maximum/Minimum in [Tagen]. Der Parameter hat Einfluss auf die Kurvenskala. Wenn er auf "0" gesetzt wird, werden alle verfügbaren Datenraten zur Ermittlung von Max/Min verwendet. Bei der Einstellung "0" besteht folgendes Risiko: Wenn es einen starken Trend in der Vergangenheit gibt, wird dieser als Norm genommen und andere Trends werden im Vergleich dazu "schwach" aussehen.
- +/- Breite des Nullbandes: Größe des Bandes, das als Nullwert betrachtet wird. Die bearbeitete Kurve wird auf 0 gesetzt, wenn ihr absoluter Wert unter dieser Grenze liegt. Empfohlener Bereich ist <0,0.1>.
- Trendparametern Rohdaten anzeigen: Rohdatenkurven (ohne zusätzliche SMA-Filterung und Nullband-Nullen) werden ebenfalls im Diagramm (als Punktlinien) angezeigt, wenn der Parameter auf "JA" gesetzt ist.
- Trendbeschleunigung anzeigen: Die gelbe Kurve (Beschleunigung/Verzögerung) wird ausgeblendet, wenn der Parameter auf "NEIN" gesetzt ist.
Bedeutung der Werte und Kombinationen
Ein positiver Bereich der blauen Kurve zeigt einen Aufwärtstrend an, ein negativer Bereich einen Abwärtstrend. Der Wert 1 (-1) zeigt den stärksten Aufwärtstrend (Abwärtstrend) in der gewählten Zeitspanne an.
Der positive Bereich der gelben Kurve zeigt die Tendenz des Trends an, positiv zu werden: Bei einem Aufwärtstrend bedeutet dies eine Beschleunigung und Verstärkung, bei einem Abwärtstrend eine Verlangsamung und Abschwächung.
Der negative Bereich der gelben Kurve zeigt die Tendenz des Trends an, negativ zu werden: Bei einem Abwärtstrend bedeutet dies Beschleunigung und Verstärkung, bei einem Aufwärtstrend bedeutet dies Verlangsamung und Abschwächung.
Der Bereich der gelben Beschleunigungs-/Abschwächungskurve ist <-1, 1>. Sie ist auf die maximale Beschleunigung/Verzögerung in der gewählten Zeitspanne normiert.
Aufgrund der automatischen Skalierung der Kurve können Werte im Bereich von ca. <-0,1, 0,1> als Null auf den borh-Kurven betrachtet werden.
Anwendung
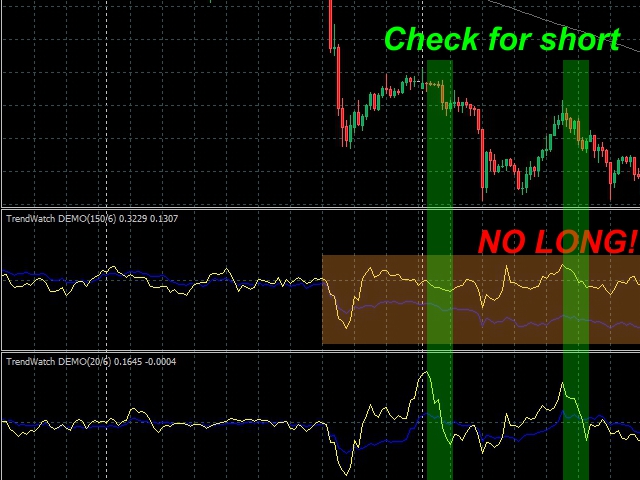
Eine gute Idee ist es, zwei TrendWatch-Indikatoren mit unterschiedlichen SMA-Periodeneinstellungen zu verwenden. Zum Beispiel 150 für den langfristigen Trend und 20 für den kurzfristigen Trend. Der Trend ist Ihr Freund: Versuchen Sie nicht, short zu gehen, wenn die langfristige blaue Kurve positiv ist; versuchen Sie nicht, long zu gehen, wenn die langfristige blaue Kurve negativ ist. Für einen bestimmten Handel prüfen Sie die kurzfristige blaue und gelbe Kurve. Für einen Short-Handel sollten Sie einen leicht positiven bis negativen Übergang oder eine Null auf der blauen Kurve und einen abschließenden positiven Impuls auf der gelben Kurve sehen (und umgekehrt für einen Long-Handel). Ein Beispiel ist auf dem Screenshot zu sehen.
Kostenlose DEMO verfügbar:
Für erste Erfahrungen finden Sie die eingeschränkte kostenlose Version TrendWatch DEMO im kostenlosen Bereich.