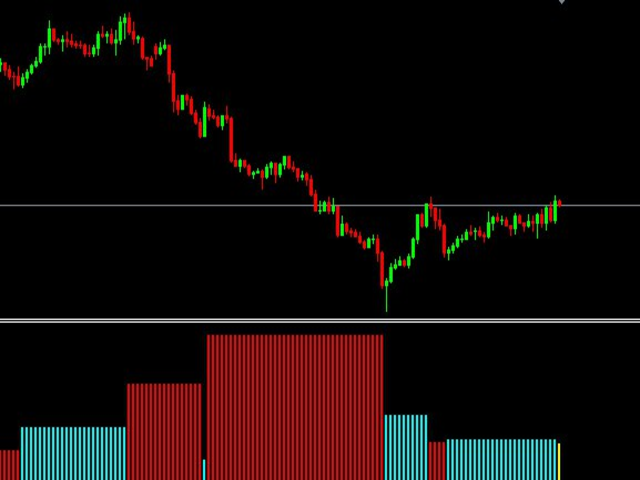
• Übersicht
  • Bewertungen
  • Diskussion

Weis Waves Result

The result as the name explain, displays the result of a swing. Sometimes weis waves show a big effort, but a little result... The weis waves result is a better revelation about the volume, if united with weis waves. it is a volume indicator, but it is different from a conventional volume indicator, this indicator came from the wyckoff method, if you use the result you will have a different view of the market, regardless of which asset is operating.
Empfohlene Produkte
Box Weis Wave
Thalles Nascimento De Carvalho
5 (1)
Wenn Sie ein aktiver Trader sind und eine effektive Möglichkeit suchen, die Bewegungen auf dem Finanzmarkt zu interpretieren, werden Sie es lieben, den Weis Wave Box kennenzulernen. Dieser unglaubliche Indikator wurde entwickelt, um eine klare und genaue visuelle Analyse von Volumenwellen sowie die Darstellung der entsprechenden Swing-Punkte zu bieten. Mit seinen fünf anpassbaren Swing-Formen und anderen einzigartigen Funktionen ist der Weis Wave Box ein unverzichtbares Werkzeug sowohl für erfah
Mini Chart Indicators
Flavio Javier Jarabeck
The Metatrader 5 has a hidden jewel called Chart Object, mostly unknown to the common users and hidden in a sub-menu within the platform. Called Mini Chart, this object is a miniature instance of a big/normal chart that could be added/attached to any normal chart, this way the Mini Chart will be bound to the main Chart in a very minimalist way saving a precious amount of real state on your screen. If you don't know the Mini Chart, give it a try - see the video and screenshots below. This is a gr
Weis Waves
Flavio Javier Jarabeck
3.15 (26)
The original author is David Weis, an expert in the Wyckoff Method. The Weis Wave is a modern adaptation of the 1930's Wyckoff Method, another expert in Tape Reading techniques and Chart Analysis. Weis Waves takes market volume and stacks it into waves according to price conditions giving the trader valuable insights about the market conditions. If you want to learn more about this subject you can find tons of videos in YouTube. Just look for "The Wickoff Method", "Weis Wave" and "Volume Spread
FREE
Weis Wave Double Side
Eduardo Da Costa Custodio Santos
Der Weis Wave Bouble Side Indicator für MT5 ist Teil des Toolkits (Wyckoff Academy Wave Market) Der Weis Wave Bouble Side Indicator für MT5 wurde basierend auf dem bereits etablierten Weis Wave von David Weis entwickelt. Der Weis Wave Double Side Indikator liest den Markt in Wellen, wie er gemacht wurde von R. Wyckoff im Jahr 1900. Es hilft bei der Identifizierung von Aufwand x Ergebnis, Ursache und Wirkung sowie Angebot und Nachfrage Sein Unterschied besteht darin, dass es unterhalb der Nullach
Volume Waves
Paulo Henrique Faquineli Garcia
One of the best tools for analyzing volume, Weis Wave was devised by David Weis to facilitate reading the directional flow. For the disciples of the Wyckoff method, this means an evolution, facilitating a predictive reading of the market, always looking for Accumulation and Distribution zones for traded assets. For better understanding, in this indicator we try to cover every reading of EFFORT (traded volume) versus RESULT (price change). Thus, you can apply the indicator on the chart twice
Follow The Line MT5
Oliver Gideon Amofa Appiah
4.4 (30)
This indicator obeys the popular maxim that: "THE TREND IS YOUR FRIEND" It paints a GREEN line for BUY and also paints a RED line for SELL. (you can change the colors). It gives alarms and alerts of all kinds. IT DOES NOT REPAINT and can be used for all currency pairs and timeframes. Yes, as easy and simple as that. Even a newbie can use it to make great and reliable trades. NB: For best results, get my other premium indicators for more powerful and reliable signals. Get them here: https://www.m
FREE
WAPV Box Effort x Result
Eduardo Da Costa Custodio Santos
WA_PV_BOX_EFFORT X ERGEBNIS für MT5 Der WAPV Box Effort x Result Indicator ist Teil der Package Indicators-Gruppe (Wyckoff Academy Wave Market). Der WAPV Box Effort x Result Indicator für MT5 hilft Ihnen beim Lesen von Preis und Volumen. Seine Lektüre besteht darin, bei der Identifizierung von Aufwand x Ergebnis zu helfen in Wellen, die durch den Graphen erzeugt werden. Der WAPV Box Effort x Result Indicator für MT5 bedeutet, wenn das Kästchen grün ist, dass das Volumen der Nachfrage entspricht,
The Accumulation / Distribution is an indicator which was essentially designed to measure underlying supply and demand. It accomplishes this by trying to determine whether traders are actually accumulating (buying) or distributing (selling). This indicator should be more accurate than other default MT5 AD indicator for measuring buy/sell pressure by volume, identifying trend change through divergence and calculating Accumulation/Distribution (A/D) level. Application: - Buy/sell pressure: above
WAPV Weis Wave Chart MT5
Eduardo Da Costa Custodio Santos
Das Weis Wave Chart für MT5 ist ein Preis- und Volumenindikator. Die Lesart von Preis und Volumen wurde durch Richard Demille Wyckoff auf der Grundlage der drei von ihm geschaffenen Gesetze verbreitet: Angebot und Nachfrage, Ursache und Wirkung und Aufwand vs. Ergebnis. Bereits 1900 verwendete R.Wyckoff das Wellendiagramm in seinen Analysen. Viele Jahre später, um 1990, automatisierte David Weis das Wellendiagramm von R. Wyckoff, und heute bringen wir Ihnen die Entwicklung des Wellendiagramms vo
Wapv Price and volume
Eduardo Da Costa Custodio Santos
Der WAPV Price and Volume Indicator for MT5 ist Teil des Toolsets (Wyckoff Academy Wave Market) und (Wyckoff Academy Price and Volume). Der WAPV-Preis- und Volumenindikator für MT5 wurde entwickelt, um die Volumenbewegung auf dem Chart auf intuitive Weise einfach zu visualisieren. Damit können Sie die Momente des Spitzenvolumens und Momente beobachten, in denen der Markt kein professionelles Interesse hat Identifizieren Sie Momente, in denen sich der Markt durch Trägheit bewegt und nicht durch d
Eine der Zahlenfolgen heißt „Forest Fire Sequence“. Es wurde als eine der schönsten neuen Sequenzen anerkannt. Sein Hauptmerkmal ist, dass diese Sequenz lineare Trends vermeidet, selbst die kürzesten. Diese Eigenschaft bildete die Grundlage dieses Indikators. Bei der Analyse einer Finanzzeitreihe versucht dieser Indikator, alle möglichen Trendoptionen abzulehnen. Und nur wenn er scheitert, dann erkennt er das Vorhandensein eines Trends und gibt das entsprechende Signal. Dieser Ansatz ermöglicht
HLC bar MT5 Wyckoff
Eduardo Da Costa Custodio Santos
Der Indikator "HLC_bar_MT5 Wyckoff" für MT5 wurde erstellt, um die Analyse zum Zeitpunkt des Handels zu erleichtern. Die HLC Bar wurde von Richard Wyckoff verwendet und wird derzeit häufig in "VSA" -Operationen verwendet. Wyckoff stellte fest, dass die Verwendung von High, Low und Close den Graphen viel sauberer und einfacher zu analysieren machte. Der Indikator "HLC_bar_MT5 Wyckoff" ermöglicht: # Ändern Sie die Balkenbreite; # Lassen Sie die Leiste dieselbe Farbe; # Und markieren Sie die Bar, d
Alpha Trend Pro
Eslam Mohamed Abdelrady Shehata
Alpha Trend Pro: Your Ultimate Trading Companion Embark on a new era of trading with Alpha Trend Pro Indicator. Crafted with precision and innovation, Alpha Trend is designed to elevate your trading experience by seamlessly blending powerful elements to navigate various market conditions. **Key Features:** **1. Dynamic Adaptability:**    - In sideways market conditions, Alpha Trend acts as a dead indicator. Say goodbye to many false signals and welcome a tool that adapts seamlessly to mar
Donchian Channel DC is the indicator of Donchian Channels, that plots maximum and minimum values of a specific period, besides mean value line. It´s possible to configure simple period for analysis and the indicator will plot all three values. You can trade with this indicator as trend or reversal, according to each strategy. Do not let to test others indicators as soon as others expert advisors.
Value Chart Candlesticks
Flavio Javier Jarabeck
4.75 (8)
The idea of a Value Chart indicator was presented in the very good book I read back in 2020 , " Dynamic Trading Indicators: Winning with Value Charts and Price Action Profile ", from the authors Mark Helweg and David Stendahl. The idea is simple and the result is pure genius: Present candlestick Price analysis in a detrended way! HOW TO READ THIS INDICATOR Look for Overbought and Oversold levels. Of course, you will need to test the settings a lot to find the "correct" one for your approach.
FREE
LT Donchian Channel
Thiago Duarte
4.75 (4)
Donchian Channel is an indicator created by Richard Donchian. It is formed by taking the highest high and the lowest low of the last specified period in candles. The area between high and low is the channel for the chosen period. Its configuration is simple. It is possible to have the average between the upper and lower lines, plus you have alerts when price hits one side. If you have any questions or find any bugs, please contact me. Enjoy!
FREE
Weis Wave Double Side Alert
Eduardo Da Costa Custodio Santos
Der Weis Wave Bouble Side Indicator für MT5 ist Teil des Toolkits (Wyckoff Academy Wave Market) Der Weis Wave Bouble Side Indicator für MT5 wurde basierend auf dem bereits etablierten Weis Wave von David Weis entwickelt. Der Weis Wave Double Side Indikator liest den Markt in Wellen, wie es R. Wyckoff im Jahr 1900 tat. Es hilft bei der Identifizierung von Aufwand x Ergebnis, Ursache und Wirkung sowie Angebot und Nachfrage Sein Unterschied besteht darin, dass es unterhalb der Nullachse verwendet w
Trendseite - ein technischer Indikator zur Bestimmung des Trends. Es ist eine Reihe von mehreren vollwertigen Handelsstrategien. Der Indikator verwendet ein fortschrittliches Trendfiltersystem, hat ein statistisches Panel, berechnet Einstiegs- und Ausstiegsniveaus und berechnet das dynamische Trailing-Stop-Niveau. Geeignet für jede Art von Symbolen, zeichnet seine Signale und Ergebnisse niemals neu. Ein umfassendes Tool für den professionellen Trendhandel. Das Set des Trend Side-Indikators um
Waves PRO
Flavio Javier Jarabeck
For those who appreciate Richard Wyckoff approach for reading the markets, we at Minions Labs designed a tool derived - yes, derived, we put our own vision and sauce into this indicator - which we called Waves PRO . This indicator provides a ZigZag controlled by the market volatility (ATR) to build its legs, AND on each ZigZag leg, we present the vital data statistics about it. Simple and objective. This indicator is also derived from the great book called " The Secret Science of Price and Volum
Want to make the graph cleaner? Don't you use the opening price in your analysis? Want to use a chart model that was used by Richard Wyckoff? Then you need to know the Color HLC Candles and Bars indicator. In the same indicator you can switch to the display of candles or bars. Take a look at the other volume indicators to complement your operating. And don't forget to look at the best Vwap Custom (Midas)! Leave your comment! Success and good trades!
True Weis Wave
Atila Goncalves Firmino
A version based on David Waves' description in his book 'Trade About to Happen' of his adaptation of the Wyckoff wave chart. The indicator directionally accumulates volume, adding to each brick or candle close, with color indication for up and down. it can be used it with tick or real volume, it also changes color when the accumulated value of the previous wave is exceeded, being the trade signal. Yellow color is used for doji candlestick, it will continue with accumulation without zero the sum
This is Gekko's Cutomized Cutomized Average Directional Index (ADX), a customized version of the famous ADX indicator. Use the regular ADX and take advantage two entry signals calculations and different ways of being alerted whenever there is potential entry or exit point. Inputs Period: Period for the ADX calculation; PlotSignalType: How will the indicator calculate entry (swing) signals: 1- ShowSwingsOnTrendLevel : Show Signals for Trend Confirmation Swings; 2- ShowSwingsOnTrendLevelDirectio
Developed by Smart Trader - Smart Reversion Pattern is an indicator capable of identifying reversal patterns , both bullish reversals and bearish reversals. It is designed to provide fast, real-time awareness of patterns. We also thought about the interface part, creating a clean and pleasant look to identify formation patterns on the chart. Note: If any pattern you need is not listed, just contact us and request inclusion - we usually respond within a few hours. Bearish Reversal P
White Weis Volume Ticks
Ricardo Almeida Branco
5 (3)
White Weis Volume This indicator shows the sum of the volume in each wave, bulish or bearish, as idealized by David Weis , but it brings an important addition , which is the marking of the bar with the highest volume of the wave (White Bar)! In coding the indicator, it was sought to optimize the code to require minimal processing during use and not to overload mt5. The indicator can be used for pre-trading analysis and study, where the trader analyzes possible points of support and resi
Tabajara V5
Flavio Javier Jarabeck
4.87 (38)
Metatrader 5 version of the famous Andre Machado's Tabajara indicator. If you don't know Andre Machado's Technical Analysis work you don't need this indicator... For those who need it and for those several friend traders who asked this porting from other platforms, here it is... FEATURES 8-period Moving Average 20-period Moving Average 50-period Moving Average 200-period Moving Average Colored candles according to the inflexion of the 20-period MA SETTINGS You can change the Period of all M
FREE
Diese innovative Währung Stärke Messindikator von INFINITY ist ein unverzichtbarer Helfer für Scalper und Händler, die in langen Handel. Das System der Analyse der Stärke / Schwäche der Währungen ist seit langem bekannt und wird auf dem Markt von den führenden Händlern der Welt verwendet. Jeder Arbitrage-Handel kommt nicht ohne diese Analyse aus. Unser Indikator bestimmt leicht die Stärke der zugrunde liegenden Währungen in Bezug aufeinander. Es zeigt Liniendiagramme für alle oder das aktuelle
Bollinger Bands B
Flavio Javier Jarabeck
5 (3)
John Bollinger created this indicator in 2010 as a way to read the original indicator (Bollinger Bands) in a more "technical" way, shown as an oscillator. The typical range of the Bollinger Bands %B is 0 - 0.5 - 1.0, where "0" represents the lower band, the "0.5" the middle band, and "1" the upper band. The line on the indicator represents the Closing prices. As simple as that. SETTINGS Bollinger Bands period of analysis Standard Deviation multiplier Shift Price type to be analyzed If you
FREE
Segmented Volume MT5
Eduardo Da Costa Custodio Santos
Der MT5 Segmented Volume Indikator wurde entwickelt, um den Handel mit Preis- und Volumenanalyse, VSA, VPA, Wyckoff-Methode und Smart Money System zu erleichtern. Segmentiertes Volumen funktioniert auf jedem Markt (Krypto, CFD, Forex, Futures, Aktien...) und funktioniert zu jeder Chart-Zeit. Sehen Sie, wie einfach Ihre Interpretation ist: #Grün: Volumen viel höher als der Marktdurchschnitt #Dunkelrosa: Überdurchschnittliches Volumen #Blau: Positive Normallautstärke #Rot: Negative Normallautstärk
Noize Absorption Index - is the manual trading system that measures the difference of pressure between bears forces and bulls forces. Green line - is a noize free index that showing curent situation. Zero value of index shows totally choppy/flat market.Values above zero level shows how powerfull bullish wave is and values below zero measures bearish forces.Up arrow appears on bearish market when it's ready to reverse, dn arrow appears on weak bullish market, as a result of reverse expectation.
To download MT4 version please click here . - This is the exact conversion from TradingView: " PA-Adaptive Hull Parabolic " By "Loxx". - This is a non-repaint and light processing load indicator - You can message in private chat for further changes you need. - All input options are available. - Buffers are available for processing within EAs. - Highlight option is omitted as does not show good in Metatrader. 
Käufer dieses Produkts erwarben auch
Atomic Analyst MT5
Issam Kassas
4.22 (9)
Zunächst einmal ist es erwähnenswert, dass dieser Handelsindikator nicht neu malt, nicht neu zeichnet und keine Verzögerung aufweist, was ihn sowohl für manuellen als auch für Roboterhandel ideal macht. Der Atom-Analyst ist ein PA-Preisaktionsindikator, der die Stärke und das Momentum des Preises nutzt, um einen besseren Vorteil auf dem Markt zu finden. Ausgestattet mit fortschrittlichen Filtern, die helfen, Rauschen und falsche Signale zu entfernen, und das Handelspotenzial zu erhöhen. Durch
Zunächst einmal ist es wichtig zu betonen, dass dieses Handelssystem ein Nicht-Repainting-, Nicht-Redrawing- und Nicht-Verzögerungsindikator ist, was es sowohl für manuelles als auch für automatisches Trading ideal macht. Das "Smart Trend Trading System MT5" ist eine umfassende Handelslösung, die für neue und erfahrene Trader maßgeschneidert ist. Es kombiniert über 10 Premium-Indikatoren und bietet mehr als 7 robuste Handelsstrategien, was es zu einer vielseitigen Wahl für verschiedene Marktbe
Quantum Trend Sniper
Bogdan Ion Puscasu
5 (36)
Wir stellen vor       Quantum Trend Sniper Indicator   , der bahnbrechende MQL5-Indikator, der die Art und Weise, wie Sie Trendumkehrungen erkennen und handeln, verändert! Entwickelt von einem Team erfahrener Händler mit über 13 Jahren Handelserfahrung,       Quantum Trend Sniper-Indikator       wurde entwickelt, um Ihre Trading-Reise mit seiner innovativen Methode zur Identifizierung von Trendumkehrungen mit extrem hoher Genauigkeit auf ein neues Niveau zu heben. ***Kaufe Quantum Trend Snipe
Trend Screener Pro MT5
STE S.S.COMPANY
4.89 (61)
Nutzen Sie die Macht des Trendhandels mit Trend Screener Indicator: Ihrer ultimativen Trendhandelslösung, die auf Fuzzy-Logik und einem System mit mehreren Währungen basiert! Steigern Sie Ihren Trendhandel mit Trend Screener, dem revolutionären Trendindikator mit Fuzzy-Logik. Es handelt sich um einen leistungsstarken Trendfolgeindikator, der über 13 Premium-Tools und -Funktionen sowie 3 Handelsstrategien kombiniert und ihn zu einer vielseitigen Wahl macht, um Ihren Metatrader in einen Trendanaly
Advanced Supply Demand MT5
Bernhard Schweigert
4.53 (15)
Derzeit 33% Rabatt! Die beste Lösung für jeden Anfänger oder erfahrenen Händler! Dieser Indikator ist ein einzigartiges, qualitativ hochwertiges und erschwingliches Trading-Tool, da wir eine Reihe von proprietären Funktionen und eine neue Formel integriert haben. Mit diesem Update werden Sie in der Lage sein, doppelte Zeitrahmenzonen anzuzeigen. Sie können nicht nur einen höheren TF (Zeitrahmen) anzeigen, sondern sowohl den Chart-TF als auch den höheren TF: SHOWING NESTED ZONES. Alle Supply Dema
RelicusRoad Pro MT5
Relicus LLC
4.81 (21)
Jetzt 147 US -Dollar (nach ein paar Aktualisierungen auf 499 US -Dollar) - Unbegrenzte Konten (PCs oder MACs) RelicusRoad Benutzerhandbuch + Schulungsvideos + Zugang zur privaten Discord-Gruppe + VIP-Status EINE NEUE ART, DEN MARKT ZU BETRACHTEN RelicusRoad ist der weltweit leistungsstärkste Handelsindikator für Forex, Futures, Kryptowährungen, Aktien und Indizes und gibt Händlern alle Informationen und Tools, die sie benötigen, um profitabel zu bleiben. Wir bieten technische Analysen un
Zunächst einmal ist es wichtig zu betonen, dass dieses Handelstool ein Nicht-Repaint-, Nicht-Redraw- und Nicht-Verzögerungsindikator ist, was es ideal für professionelles Trading macht. Der Smart Price Action Concepts Indikator ist ein sehr leistungsstarkes Werkzeug sowohl für neue als auch erfahrene Händler. Er vereint mehr als 20 nützliche Indikatoren in einem und kombiniert fortgeschrittene Handelsideen wie die Analyse des Inner Circle Traders und Strategien des Smart Money Concepts. Diese
Wir stellen vor       Quantum Breakout PRO   , der bahnbrechende MQL5-Indikator, der die Art und Weise, wie Sie mit Breakout-Zonen handeln, verändert! Entwickelt von einem Team erfahrener Händler mit über 13 Jahren Handelserfahrung,       Quantum Breakout PRO       ist darauf ausgelegt, Ihre Handelsreise mit seiner innovativen und dynamischen Breakout-Zone-Strategie auf ein neues Niveau zu heben. Der Quantum Breakout Indicator zeigt Ihnen Signalpfeile auf Breakout-Zonen mit 5 Gewinnzielzone
FX Power MT5 NG
Daniel Stein
5 (4)
Erhalten Sie Ihr tägliches Marktupdate mit Details und Screenshots über unser Morning Briefing hier auf mql5 und auf Telegram ! FX Power MT5 NG ist die nächste Generation unseres langjährig sehr beliebten Währungsstärkemessers FX Power. Und was bietet dieser Stärkezähler der nächsten Generation? Alles, was Sie am ursprünglichen FX Power geliebt haben PLUS GOLD/XAU-Stärkeanalyse Noch präzisere Berechnungsergebnisse Individuell konfigurierbare Analysezeiträume Anpassbares Berechnungslimit für noc
AW Trend Predictor MT5
AW Trading Software Limited
4.76 (54)
Die Kombination von Trend- und Aufschlüsselungsebenen in einem System. Ein fortschrittlicher Indikatoralgorithmus filtert Marktrauschen, bestimmt den Trend, Einstiegspunkte sowie mögliche Ausstiegsniveaus. Indikatorsignale werden in einem Statistikmodul aufgezeichnet, das es Ihnen ermöglicht, die am besten geeigneten Tools auszuwählen, die die Wirksamkeit der Signalhistorie zeigen. Der Indikator berechnet Take-Profit- und Stop-Loss-Marken. Handbuch und Anleitung ->   HIER   / MT4-Version ->   H
FX Volume MT5
Daniel Stein
4.94 (17)
Erhalten Sie Ihr tägliches Marktupdate mit Details und Screenshots über unser Morning Briefing hier auf mql5 und auf Telegram ! FX Volume ist der ERSTE und EINZIGE Volumenindikator, der einen ECHTEN Einblick in die Marktstimmung aus Sicht eines Brokers bietet. Es bietet fantastische Einblicke in die Positionierung von institutionellen Marktteilnehmern, wie z.B. Brokern, auf dem Forex-Markt, viel schneller als COT-Berichte. Diese Informationen direkt auf Ihrem Chart zu sehen, ist der wahre Game
Dies ist ein Indikator für MT5, der genaue Signale für den Einstieg in einen Handel ohne Repainting (Neuzeichnen) liefert. Er kann auf alle Finanzwerte angewendet werden: Forex, Kryptowährungen, Metalle, Aktien, Indizes. Er liefert ziemlich genaue Schätzungen und sagt Ihnen, wann es am besten ist, eine Position zu eröffnen und zu schließen. Sehen Sie sich das Video (6:22) mit einem Beispiel für die Verarbeitung nur eines Signals an, das sich für den Indikator gelohnt hat! Die meisten Händler ver
TPSpro TRENDPRO  - is a trend indicator that automatically analyzes the market and provides information about the trend and each of its changes, as well as giving signals for entering trades without redrawing! The indicator uses each candle, analyzing them separately. referring to different impulses - up or down impulse. Exact entry points into transactions for currencies, crypto, metals, stocks, indices!  -  Version MT4                  DETAILED DESCRIPTION        /       TRADING SETUPS       
Bill Williams Advanced
Siarhei Vashchylka
5 (3)
Bill Williams Advanced is designed for automatic chart analysis using Bill Williams' "Profitunity" system. The indicator analyzes four timeframes at once. Manual (Be sure to read before purchasing) Advantages 1. Automatically analyzes the chart using the "Profitunity" system of Bill Williams. The found signals are placed in a table in the corner of the screen. 2. Equipped with a trend filter based on the Alligator indicator. Most of the system signals are recommended to be used only accordi
ICT, SMC, SMART MONEY CONCEPTS, SMART MONEY, Smart Money Concept, Support and Resistance, Trend Analysis, Price Action, Market Structure, Order Blocks, BOS/CHoCH,   Breaker Blocks ,  Momentum Shift,   Supply&Demand Zone/Order Blocks , Strong Imbalance,   HH/LL/HL/LH,    Fair Value Gap, FVG,  Premium  &   Discount   Zones, Fibonacci Retracement, OTE, Buy Side Liquidity, Sell Side Liquidity, BSL/SSL Taken, Equal Highs & Lows, MTF Dashboard, Multiple Time Frame, BigBar, HTF OB, HTF Market Structure
TrendMaestro5
Stefano Frisetti
note: this indicator is for METATRADER4, if you want the version for METATRADER5 this is the link:  https://www.mql5.com/it/market/product/108106 TRENDMAESTRO recognizes a new TREND in the bud, he never makes mistakes. The certainty of identifying a new TREND is priceless. DESCRIPTION TRENDMAESTRO identifies a new TREND in the bud, this indicator examines the volatility, volumes and momentum to identify the moment in which there is an explosion of one or more of these data and therefore the mome
Auto Order Block with break of structure based on ICT and Smart Money Concepts Futures Break of Structure ( BoS )             Order block ( OB )            Higher time frame Order block / Point of Interest ( POI )    shown on current chart           Fair value Gap ( FVG ) / Imbalance   ,  MTF      ( Multi Time Frame )    Volume Imbalance     ,  MTF          vIMB Gap’s Equal High / Low’s     ,  MTF             EQH / EQL Liquidity               Current Day High / Low           HOD /
TrendDecoder Premium MT5
Christophe, Pa Trouillas
5 (1)
Top bewertet auf anderem MarketPlace -  Jetzt verfügbar auf METATRADER Identifizieren Sie Bereiche und die nächsten wahrscheinlichen Bewegungen     |    Erhalten Sie früheste Signale und die Stärke von Trends     |    Klare Ausstiegssignale vor Umkehrung     |    Erkennen Sie die Fibo-Levels, die der Kurs testen wird    |  Indikator, der nicht zurückverfolgt, nicht verzögert - ideal für den manuellen und automatisierten Trading - geeignet für alle Vermögenswerte und Zeiteinheiten - 50% Rabatt  
XQ Indicator MetaTrader 5
Marzena Maria Szmit
5 (1)
Step into the realm of Forex trading with confidence and precision using XQ, a cutting-edge Forex indicator designed to elevate your trading game to unprecedented heights. Whether you're a seasoned trader or just stepping into the world of currency exchange, XQ Forex Indicator empowers you with the insights and signals needed to make informed trading decisions. The signal conditions are a combination of three indicators, and XQ Forex Indicator only display  medium and long-term trends . The ind
Werden Sie Breaker Trader und profitieren Sie von Änderungen der Marktstruktur, wenn sich der Preis umkehrt. Der Order Block Breaker Indikator zeigt an, wann sich eine Trend- oder Preisbewegung der Erschöpfung nähert und bereit ist, sich umzukehren. Es weist Sie auf Änderungen in der Marktstruktur hin, die normalerweise auftreten, wenn eine Umkehrung oder ein größerer Rückzug bevorsteht. Der Indikator verwendet eine proprietäre Berechnung, die Ausbrüche und Preisdynamik identifiziert. Jedes
TrendLine PRO MT5
Evgenii Aksenov
4.78 (49)
The Trend Line PRO indicator is an independent trading strategy. It shows the trend change, the entry point to the transaction, as well as automatically calculates three levels of Take Profit and Stop Loss protection Trend Line PRO is perfect for all Meta Trader symbols: currencies, metals, cryptocurrencies, stocks and indices Advantages of Trend Line PRO Never redraws its signals The possibility of using it as an independent strategy It has three automatic levels Take Profit and Stop Loss lev
IX Power MT5
Daniel Stein
5 (1)
IX Power   bringt die unschlagbare Präzision von FX Power endlich auch zu Nicht-Forex-Symbolen. Es bestimmt präzise die Intensität von kurz-, mittel- und langfristigen Trends in Ihren Lieblingsindizes, Aktien, Rohstoffen, ETFs und sogar Kryptowährungen. Sie können   alles analysieren, was   Ihr Terminal zu bieten hat. Probieren Sie es aus und erleben Sie, wie   sich Ihr Timing   beim Handel   deutlich verbessert . IX Power Hauptmerkmale 100% präzise, nicht nachpinselnde Berechnungsergebni
The Volume by Price Indicator for MetaTrader 5 features Volume Profile and Market Profile TPO (Time Price Opportunity). Get valuable insights out of currencies, equities and commodities data. Gain an edge trading financial markets. Volume and TPO histogram bar and line charts. Volume Footprint charts. TPO letter and block marker charts including split structures. Versatile segmentation and compositing methods. Static, dynamic and flexible ranges with relative and/or absolute visualizations. Lay
Quantum Heiken Ashi PRO MT5
Bogdan Ion Puscasu
4.5 (8)
Wir stellen den   Quantum Heiken Ashi PRO   vor Die Heiken-Ashi-Kerzen wurden entwickelt, um klare Einblicke in Markttrends zu geben und sind bekannt für ihre Fähigkeit, Rauschen herauszufiltern und falsche Signale zu eliminieren. Verabschieden Sie sich von verwirrenden Preisschwankungen und begrüßen Sie eine glattere, zuverlässigere Diagrammdarstellung. Was den Quantum Heiken Ashi PRO wirklich einzigartig macht, ist seine innovative Formel, die traditionelle Candlestick-Daten in leicht lesbare
A key element in trading is zones or levels from which decisions to buy or sell a trading instrument are made. Despite attempts by major players to conceal their presence in the market, they inevitably leave traces. Our task was to learn how to identify these traces and interpret them correctly. Reversal First Impulse levels (RFI)   -  Version MT4                  INSTRUCTIONS                 RUS                 ENG                         R ecommended to use with an indicator   -  TREND PRO  
Was: $249  Now: $99   Market Profile defines a number of day types that can help the trader to determine market behaviour. A key feature is the Value Area, representing the range of price action where 70% of trading took place. Understanding the Value Area can give traders valuable insight into market direction and establish the higher odds trade. It is an excellent addition to any system you may be using. Inspired by Jim Dalton’s book “Mind Over Markets”, this indicator is designed to suit the
Dark Power MT5
Marco Solito
4.84 (56)
Dark Power  is an Indicator for intraday trading. This Indicator is based on   Trend Following  strategy, also adopting the use of an histogram to determine the right power . We can enter in good price with this Indicator, in order to follow the   strong trend   on the current instrument. The histogram is calculated based on the size of the bars and two moving averages calculated on the histogram determine the direction of the signal Key benefits Easily visible take profit/stop loss lines Int
Golden Gate Algo MT5
James David Lane
4 (6)
40% RABATT ZU WEIHNACHTEN! PREISERHÖHUNG AUF $250 AM 1. JANUAR! Vorstellung von GoldenGate Entries: Eine hochmoderne Handelslösung! Entdecken Sie einen revolutionären Ansatz zum Handel mit GoldenGate Entries (GGE), einem fortschrittlichen Indikator, der entwickelt wurde, um Ihr Handelserlebnis zu verbessern. GGE bietet eine umfassende Palette von Funktionen, um Benutzer mit Präzision und Vertrauen in ihren Handelsentscheidungen auszustatten. Paare: Beliebig (FX - Rohstoffe - Aktien - Akti
Gartley Hunter Multi
Siarhei Vashchylka
5 (5)
Gartley Hunter Multi - An indicator for searching for harmonic patterns simultaneously on dozens of trading instruments and on all classic timeframes: (m1, m5, m15, m30, H1, H4, D1, Wk, Mn). Manual (Be sure to read before purchasing) | Version for MT4 Advantages 1. Patterns: Gartley, Butterfly, Shark, Crab. Bat, Alternate Bat, Deep Crab, Cypher 2. Simultaneous search for patterns on dozens of trading instruments and on all classic timeframes 3. Search for patterns of all possible sizes. Fr
PZ Swing Trading MT5
PZ TRADING SLU
5 (4)
Swing Trading ist der erste Indikator, der Schwankungen in Trendrichtung und mögliche Umkehrschwankungen erkennt. Es wird der in der Handelsliteratur weit verbreitete Baseline-Swing-Trading-Ansatz verwendet. Der Indikator untersucht mehrere Preis- und Zeitvektoren, um die aggregierte Trendrichtung zu verfolgen und erkennt Situationen, in denen der Markt überverkauft oder überkauft ist und zur Korrektur bereit ist. [ Installationsanleitung | Update-Anleitung | Fehlerbehebung | FAQ | Alle Produkte
Weitere Produkte dieses Autors
through this indicator you can make  analysis and also can to distinguish possible weakness or continuous strength  on  price, it is an indicator initially developed by David Weis. This version is for the meta trader 5 platform. The Weis Waves indicator is based on volume and is aligned with the price, being able to find not only possible strenght and weakness, but also possible divergences between price and volume, bringing an interesting analysis between both.
DashMarketProfile
Fillipe Dos Santos
this indicator is essential when it's necessary to identify  trade locations on  chart. You can initially get an idea of ​​the candlestick's direction with other graphical tools and then identify the best regions with the DMP. The Dash Market Profile is a statistical indicator, that mean it is an indicator that is based on mathematical calculations, identifying the best regions and observing the candles of the best regions to trade. The financial market is not as easy as it seems, it is necessar
An anchored Vwap With Arrows is an indicator that includes a moving average weighted by volume that allows you to plot on a bottom or a top. Usually banks and institutions measure an average price, this average price is a price range where they agree to make a trade. Using the logic of anchored vwap with arrows it is possible to understand that if the price breaks the vwap it means that someone with enough buying and selling power has lost control. You can use vwap anchored with arrows in any ti
CandleVolume
Fillipe Dos Santos
CandleVolume is an indicator that colors bars according to increasing or decreasing volume. You can use it to identify strategic regions of the chart and complete an analysis. White means low volume, yellow means medium volume and red means climax volume. It is a recommended indicator if you like to interpret market contexts and understand how market cycles work.
BetterVolumeTick
Fillipe Dos Santos
BetterVolumeTick it is a volume indicator. It marks the volume regions where there was a great aggression, also shows the volume intensity. Yellow means low volume, normal activity. Orange means activity with a pretty amount of volume. Red means ultra high volume. This indicator combined with the price chart will give you another view of the market context.
Auswahl:
Keine Bewertungen
Antwort auf eine Rezension