RSI Divergence Detector MT4
- Indikatoren
- Version: 1.0
- Aktivierungen: 5

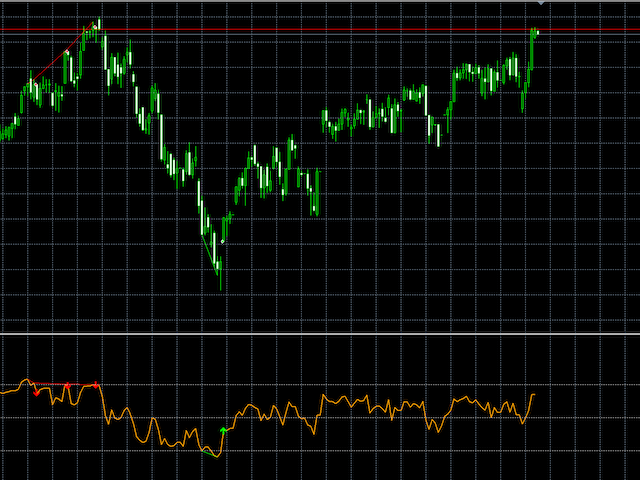
RSI Divergence Detector ist ein RSI-Indikator, der auch Divergenzen erkennt und Pfeile und Trendlinien auf dem Chart einzeichnet, wo Sie kaufen und verkaufen sollten. Bitte beachten Sie, dass dieser Indikator 5 Puffer zur Verfügung stellt und sich nicht neu malt, was ihn zu einem außergewöhnlichen Indikator für Expert Advisors macht. Der Indikator bietet auch Warnhinweise.
Puffer 0 = RSI
Puffer 1 = Kaufen
Puffer 2 = Verkaufen
Puffer 3 = RSIGradient
Puffer 4 = PreisGradient
NICHT WIEDERHOLEND
DIVERGENZERFASSUNG
Wast of money Barely shows any divergence. My Macd divergence indicator catches every thing and it was only 15 bucks.. Hot Garbage