Dunnigan Indicator
- Indikatoren
-
Leonardo Sposina
 Software Developer
 - Version: 1.4
- Aktualisiert: 11 November 2020
- Aktivierungen: 5
Es handelt sich um einen Trendindikator, der auf einer von William Dunnigan entwickelten Strategie basiert, die Kauf- oder Verkaufssignale für jeden Zeitrahmen ausgibt und bei der Entscheidungsfindung für den Handel an der Börse oder am Forex helfen kann.
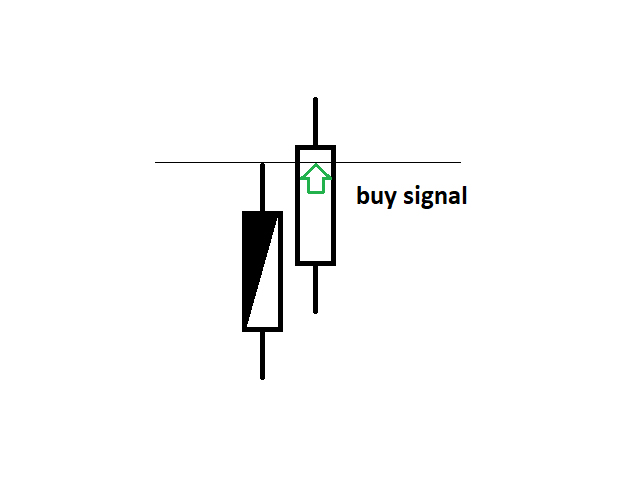
Die Signale werden nach den folgenden Regeln ausgelöst:
- Kaufsignal = Wird bei der ersten Kerze ausgelöst, bei der der Schlusskurs höher ist als der höhere Kurs der letzten Kerze. Die höheren und niedrigeren Preise der aktuellen Kerze müssen ebenfalls höher sein als die entsprechenden Preise der letzten Kerze.
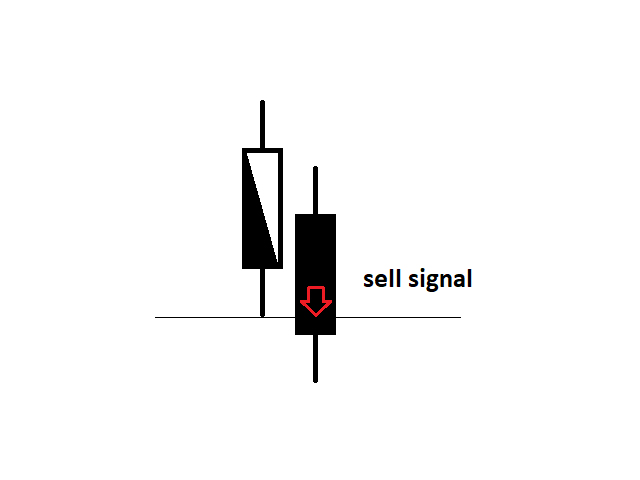
- Verkaufssignal = Wird bei der ersten Kerze ausgelöst, bei der der Schlusskurs niedriger ist als der niedrigere Kurs der letzten Kerze. Die höheren und niedrigeren Preise der aktuellen Kerze müssen ebenfalls niedriger sein als die entsprechenden Preise der letzten Kerze.
Obs: Both signals are confirmed by the increase in the tick volume before firing.
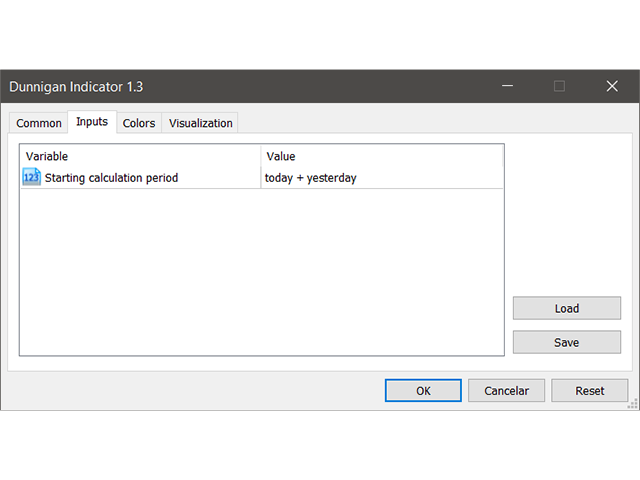
Inputs:
- Beginnende Berechnungsperiode: Dies ist der Anfangsberechnungszeitraum für die Dunnigan-Signale. Zur Auswahl stehen "heute", "heute + gestern", "heute + letzte 2 Tage", "heute + letzte 3 Tage", "heute + letzte 4 Tage", "heute + letzte 5 Tage" und "heute + letzte 6 Tage".
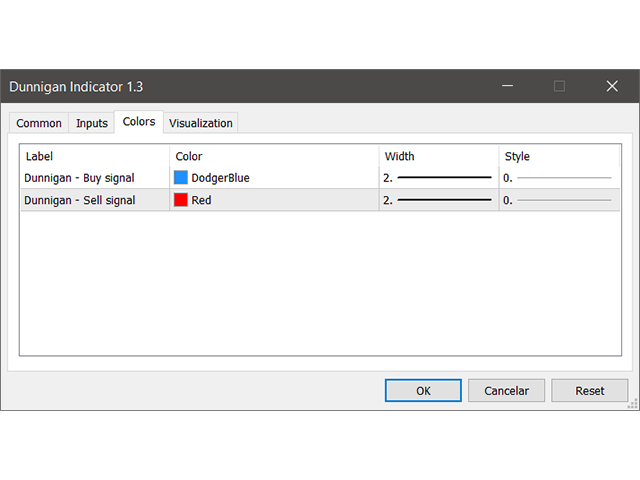
Farben:
- Farbe und Breite der Dunnigan-Signalpfeile.