• Übersicht
  • Bewertungen
  • Diskussion
  • Neue Funktionen

Wave Trend Indicator

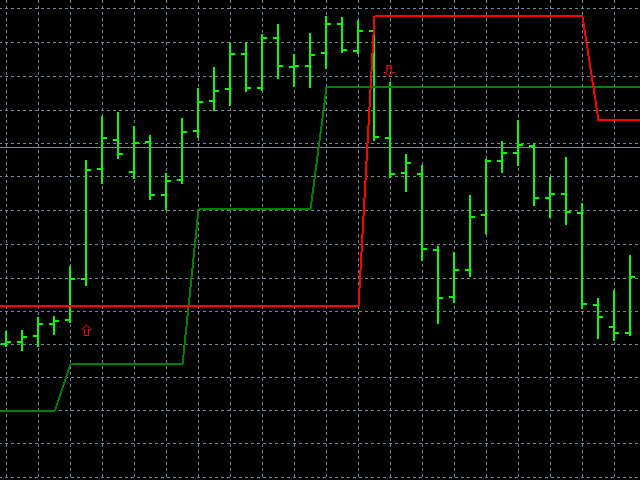
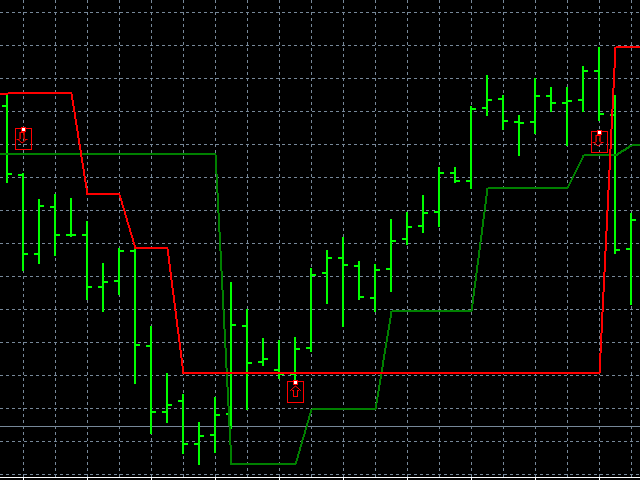
Die hohen und niedrigen Bandpunkte, die streng nach Dow's Theorie gemacht werden, können verwendet werden, um die Position von Support und Widerstand zu unterscheiden, den Ausgangspunkt des Trends zu identifizieren und Verluste zu stoppen und zu stoppen.


Ob Sie ein Trendbetreiber, ein kurzfristiger Intraday -Händler oder ein Kopfhaut -Händler sind, ich glaube, dieser Indikator wird Ihnen sehr helfen.


Zum Beispiel, wenn der Preis durch die grüne Linie geht, beginnt der aktuelle kurze Trend, und wenn der Preis durch die rote Linie geht, beginnt der Bulltrend, die entsprechenden hohen und niedrigen Punkte wirken als effektive Haltestelle für Öffnungspositionen, und die entsprechende umgekehrte Kreuzung fungiert als Halteposition.


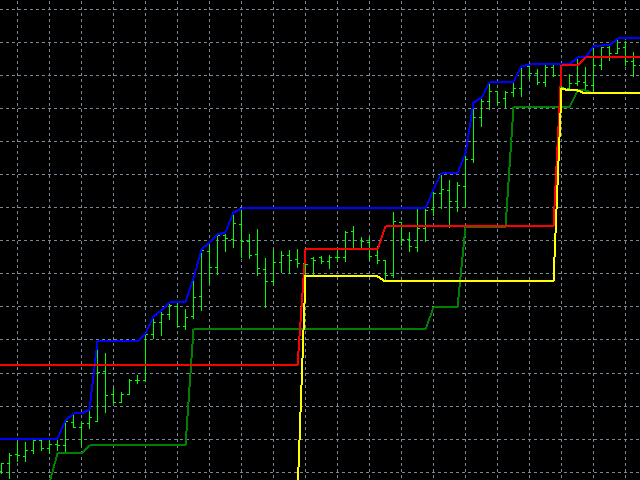
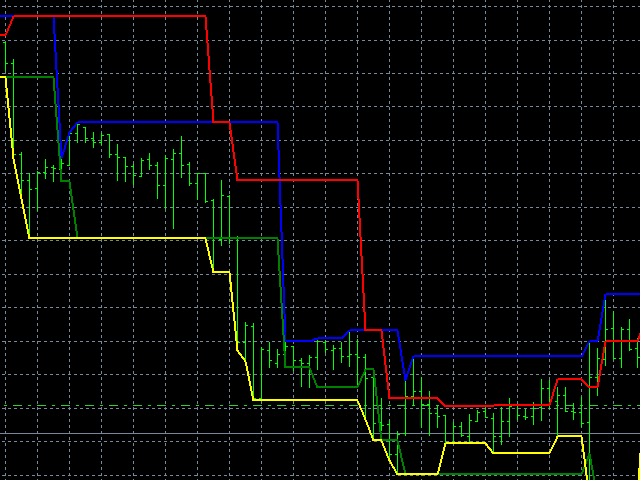
Natürlich können mit anderen Theorien wie Diagrammen, Gann, Schildkröten und so weiter Indikatoren eine größere Rolle spielen.


Ich werde hier nicht mehr auf Details eingehen. Sie können weitere interessante Anwendungen dieses Indikators nach Ihrer Handelsstrategie finden.


Indikatoren haben keine externen Parameter, und die Ergebnisse werden nicht inkonsistent sein, je nach Anzahl der Backtracking -Säulen. Alle verwendeten Bedingungen sind vollständig vom Markt, d.h. der Markt wird immer den Schritten des Marktes folgen.
Empfohlene Produkte
This is a new strategy for SUPPLY DEMAND areas It is based on a calculation using the tick volume to detect the big price action in market for both bear /bull actions this smart volume action candles are used to determine the supply and demand areas prices in between main supply and demand lines indicate sideway market  up arrows will be shown when prices moves above the main supply and the secondary supply lines Down arrows will be shown when prices moves below the main demand and the secondary
A Boss Stats
Anthonius Soruh
Hi Trader, We are strategy development for Binary and Forex tools, our product have success for binary trading 1 min - 2 min experation. At the moment I build indicator for trading all day, not like Bonosu series with specific time. We launch A-Boss Stats Indicator for trading 1 minute to 5 minutes experation is mean can trade from 1 minutes - 5 minutes. Specification of A Boss Stats trading binary option: Work with all MT4 broker. Chart Time Frame M1 only, can use M5 Experation time for contact
Daily Candle Predictor ist ein Indikator, der den Schlusskurs einer Kerze vorhersagt. Der Indikator ist in erster Linie für die Verwendung in D1-Charts gedacht. Dieser Indikator eignet sich sowohl für den traditionellen Devisenhandel als auch für den Handel mit binären Optionen. Der Indikator kann als eigenständiges Handelssystem oder als Ergänzung zu Ihrem bestehenden Handelssystem verwendet werden. Dieser Indikator analysiert die aktuelle Kerze und berechnet bestimmte Stärkefaktoren innerhalb
Fibonacci Magic Pivot Levels
Savia Forex Software Solutions
Fibonacci Magic Pivot Levels The  Fibonacci Magic Pivot Levels  is a  powerful yet easy to use indicator . It   continuously monitor s intra-day  price action  and uses complex algorithms to calculate and detect key support, resistance and pivot levels, using the D1 timeframe as a filter.  The    Fibonacci Magic Pivot Levels is optimized for H4, H1, M30, M15, M5 & M1 timeframes and  can be used on ALL Currencies, Indices, Commodities, and Cryptocurrency pairs . Trade with improved confidence an
Indicator for binary options arrow is easy to use and does not require configuration works on all currency pairs, cryptocurrencies buy signal blue up arrow sell signal red down arrow tips do not trade during news and 15-30 minutes before their release, as the market is too volatile and there is a lot of noise it is worth entering trades one or two candles from the current period (recommended for 1 candle) timeframe up to m 15 recommended money management fixed lot or fixed percentage of the depo
TPO Profile MT4
Kyra Nickaline Watson-gordon
5 (1)
Definition : TPO is a Time Price Opportunity. Instead of using bars or candles with an Open, High, Low, and Close price, each "bar" in a Market Profile is represented by horizontal bars against the price It is called Market Profile terminology. In other words time-price-opportunity (TPO) profiles are histograms of how much time was spent at each price within the span of the profile. By using a TPO chart, you are able to analyze the amount of trading activity, based on time, for each price lev
Meta Treand
Tatiana Savkevych
Forex Meta Trend indicator - using the built-in algorithm allows you to determine the current trend. You can quickly understand what kind of trend is currently developing in the market. The indicator projects one of the main market wisdoms and says - "The trend is my friend". Using this indicator, you can develop a trading system in the financial markets. Since the indicator is designed specifically to create a system for searching for a market trend. This indicator does not lag and shows the tr
here is a link to back test results https://youtu.be/9BYDwS9aaqM https://youtu.be/iLxh43HV91Y However, the difficult task here for traders is to understand and select the indicator or tool that can help them with their trading plan and benefit their trading style. Traders want a tool that requires minimal effort and provides as much support as it can. There are multiple reasons for which traders need an indicator. One such reason is to determine the buy-sell signals in the market. The
VR Cub
Vladimir Pastushak
VR Cub ist ein Indikator für den Erhalt hochwertiger Einstiegspunkte. Der Indikator wurde entwickelt, um mathematische Berechnungen zu erleichtern und die Suche nach Einstiegspunkten in eine Position zu vereinfachen. Die Handelsstrategie, für die der Indikator geschrieben wurde, hat sich seit vielen Jahren bewährt. Ihr großer Vorteil liegt in der Einfachheit der Handelsstrategie, die es auch unerfahrenen Händlern ermöglicht, erfolgreich damit zu handeln. VR Cub berechnet Positionseröffnungspunkt
Strong Retracement Points Pro demo edition! SRP (Strong Retracement/Reversal Points) is a powerful and unique support and resistance indicator. It displays the closest important levels which we expect the price retracement/reversal! If all level are broken from one side, it recalculates and draws new support and resistance levels, so the levels might be valid for several days depending on the market! If you are still hesitating to start using this wonderful tool, you can check this link to see h
Fibonacci Retracements Pro
Savia Forex Software Solutions
Fibonacci Retracements Pro The Fibonacci Retracements Pro is a powerful yet easy to use indicator. It automatically plots all the important Fibonacci retracement and extension levels for you. FRP is dynamic powerful and seamlessly adjusts to whatever timeframe you are analyzing. Fibonacci Retracement Pro is optimized for ALL timeframes and ALL Currency pairs, Indices, Commodities, and Cryptocurrency pairs. Trade with improved confidence and maximize your success rate. Benefits Dynamic and Power
The new update makes this indicator a complete tool for studying, analyzing and operating probabilistic patterns. It includes: On-chart Multi-asset percentage monitor. Configurable martingales. Twenty-one pre-configured patterns , including Mhi patterns and C3. An advanced pattern editor to store up to 5 custom patterns. Backtest mode to test results with loss reports. Trend filter. Hit operational filter. Martingale Cycles option. Various types of strategies and alerts. Confluence between patte
F ully automated Expert Advisor using the  advanced   algorithm for trading the EURUSD Designed for profit in a short period of time and big profit in a long run. Prefers EURUSD 1H. Principle of operation The SELL and BUY orders are opened (depending on the parameters set), guided by signals and the market situation.     Recommended parameter: Use an ECN broker account. minimum deposit of 100$ USD. use it in H1 time frame recommended symbol is EURUSD input parameter: TrendType               
FiboPlusWaveRunner
Sergey Malysh
3.29 (7)
Experte Automatischer und manueller Handel Fertiges Handelssystem auf der Grundlage von Elliott-Wellen und Fibonacci-Niveaus . Einfach und erschwinglich Abbildung den Markup der Elliott-Wellen (Haupt- oder Alternativvariante) in einem Diagramm an Ausbau von horizontalen Ebenen, Stütz- und Widerstandslinien, Kanal Überlagerung der Fibonacci-Niveaus auf die Wellen 1, 3, 5, A Warnsystem (am Bildschirm, E-Mail, Push-Benachrichtigungen) Visuelles Feld zur Oderöffnung beim manuellen Handel Visuelles F
This indicator prepared by using 57 days moving averagr and least square method. It can only work for 1 hr time interval. Once a signal created. It is creating order and 2 limit orders. It works in CFD pairs as well as in Forex pairs. You can fins our other products from link : https://www.mql5.com/en/users/drbastem/seller Also, you can ask all your questins from email : haskayafx@gmail.com or mobile : +90 530 867 5076 or @MehmetBastem on telegram application This system is for Long term and pr
Diamond Trend
Segundo Calvo Munoz
Indicator which identifies Trend and also buy/sell opportunities. Use for entries aligned to the Trend.  Although Diamond Trend is very accurate identifying entry points, it is always recommended to use a support indicator in order to reconfirm the operation. Remind to look for those Assets and Timeframes which best fit to your trader behavior/need... Valid for Scalping and Long Term operations. Please, set up a Bars Chart to be able to visualize the indicator properly...  ...And remind to give
Awesome Oscillator by Bill Williams with the ability to fine-tune and replace the averaging algorithms of the indicator, which significantly expands the possibilities of using this oscillator in algorithmic trading and brings it closer in its properties to such an indicator as the MACD. To reduce price noise, the final indicator is processed with an additional Smooth averaging. The indicator has the ability to give alerts, send mail messages and push signals when the direction of movement of th
Der Indikator berechnet und zeichnet automatisch Fibonacci-Unterstützungs- und Widerstandsniveaus - eines der effektivsten Werkzeuge für die Marktanalyse. Die Berechnung verwendet die gemittelten Preisdaten für den ausgewählten Zeitraum und Zeitraum. Das Minimum und das Maximum für diesen Zeitraum gelten als Beginn und Ende der Bewegung. Fibonacci-Niveaus ermöglichen es Ihnen, potenzielle Referenzpunkte zu erkennen, um die sich die Preisbewegung verlangsamen oder umkehren kann, dh sie werden ver
Shark Deal Book
Philip Pankaj Suthagar
4 (3)
Term  "shark"  in the business world denotes a high volume investor who just made a good investment in a highly Potential business deal.So, sharks are the ones who make the market move. In our case, if an American shark bought a Japanese company, he/she has to convert American dollars into Japanese yen to make the deal. So, the demand for the Japanese yen will increase sharply. Thus USD/JPY will go short rapidly if the deal was from the shark. Another example, In the case of forex, if fed increa
For sure, this indicator has become very popular amongst traders. Through coding this indicator will give you the most accurate levels possible for your trading analysis. We have also added in the ability for you to receive alerts when the price breaks above or below a Support or Resistance lines! HOW TO USE The red rectangles represent your resistance/supply zone. The green rectangles represent your support/demand zone.  BONUS FEATURES We coded this indicator with the ability to switch between
Signaline
Ahmet Metin Yilmaz
SIGNALINE INDICATOR This indicator for all pairs and all timeframes I have just completed the M5 timeframe for deep optimization EURJPY yet. EURJPY M5 Optimization ( TP=150 , SL=130 , IndicatorPeriod=6 , Mov1=22 , Mov2=48 ) (*)Added 20.05.2019 You can find this signal page below https://www.mql5.com/en/signals/583477 Other optimizasyon results will be added on this signalpage. Input Parameters: IndicatorPeriod: Default is 8. Mov1               : Default is 21. Mov2               : Default is 48.
Cosmic Diviner X Planet
Olena Kondratenko
4 (2)
This unique multi-currency strategy simultaneously determines the strength of trends and market entry points, visualizing this using histograms on the chart. The indicator is optimally adapted for trading on the timeframes М5, М15, М30, Н1. For the convenience of users, the indicator renders the entry point (in the form of an arrow), recommended take profit levels (TP1, TP2 with text labels) and the recommended Stop Loss level. The take profit levels (TP1, TP2) are automatically calculated for
Night ghost
Dmitriy Kashevich
Night Ghost - Pfeilanzeige für binäre Optionen. Dies ist ein zuverlässiger Assistent für Sie in der Zukunft! - Kein Neuzeichnen auf dem Diagramm -Funktioniert hervorragend bei allen Währungspaaren! - Anzeigegenauigkeit bis zu 90 % (besonders nachts) -Keine lange Einrichtung erforderlich (perfekt für binäre Optionen eingerichtet) - Keine späten Signale - Das Erscheinen eines Signals auf der aktuellen Kerze -Perfekt für die M1-Periode (nicht mehr!) - Augenfreundliche Kerzenfar
Supply and Demand Indicator + FREE Currency Strength Meter ADD-ON Looking for a powerful tool that can help you identify the most reactive zones in the forex market? Our supply and demand indicator for MetaTrader 4 and 5 is exactly what you need. With its advanced algorithms and real-time analysis, this indicator helps traders of all experience levels make informed trading decisions. The supply and demand indicator is a cutting-edge tool that helps traders identify areas where buyers and seller
To get access to MT5 version please click   here . This is the exact conversion from TradingView: "Schaff Trend Cycle" by "everget". This is a light-load processing indicator. This is a non-repaint indicator. Buffers are available for processing in EAs. All input fields are available except fillings(due to MT4 graphical restrictions). You can message in private chat for further changes you need. Thanks for downloading
Indikator mit einem Gewinnraten-Berechnungssystem ausgestattet [Anzeigefunktionen] Dieser Indikator ermöglicht eine intuitive und einfache Bestätigung regelmäßiger technischer Analysen durch Vorzeichensignale. Darüber hinaus kann es die Angemessenheit der aktuellen Parameter überprüfen, indem es die Gewinnrate verifiziert, und verfügt über ein automatisches Gewinnraten-Ermittlungssystem, das keine Signale generiert, wenn die Gewinnrate niedrig ist. Dies reduziert unnötige Eingaben und ermögli
Blahtech Market Profile
Blahtech Limited
4.61 (18)
Was: $249  Now: $99   Market Profile defines a number of day types that can help the trader to determine market behaviour. A key feature is the Value Area, representing the range of price action where 70% of trading took place. Understanding the Value Area can give traders valuable insight into market direction and establish the higher odds trade. It is an excellent addition to any system you may be using. Blahtech Limited presents their Market Profile indicator for the MetaTrader community. Ins
Introducing the advanced trading tools of 2024. MTF PPAAF Model T. This is improvement version of MTF Precise Price Action Arrow Filtered Model S .  Click here to learn more about MTF PPAAF Model S . This trading tool is equipped with various powerful features : MTF = Multi Time Frame = Time Frame can be changed. On/off button. Non Repaint Arrows.  Customizable parameter, color etc.  Can show all time frame (ATF) crossover arrows of fast stochastic main line & fast stochastic signal line (mode
SRP Pro
Farhad Kia
5 (1)
Strong Retracement Points Pro edition! SRP (Strong Retracement/Reversal Points) is a powerful and unique support and resistance indicator. It displays the closest important levels which we expect the price retracement/reversal! If all level are broken from one side, it recalculates and draws new support and resistance levels, so the levels might be valid for several days depending on the market! If you are still hesitating to start using this wonderful tool, you can check this link to see how ef
KT Renko Patterns MT4
KEENBASE SOFTWARE SOLUTIONS
2.33 (3)
KT Renko Patterns scans the Renko chart brick by brick to find some famous chart patterns that are frequently used by traders across the various financial markets. Compared to the time-based charts, patterns based trading is easier and more evident on Renko charts due to their uncluttered appearance. KT Renko Patterns features multiple Renko patterns, and many of these patterns are extensively explained in the book titled Profitable Trading with Renko Charts by Prashant Shah. A 100% automate
Käufer dieses Produkts erwarben auch
Präsentation des Miraculous Forex Indikators: Entfesseln Sie die Kraft präzisen Tradings Sind Sie es leid, nach dem besten Forex-Indikator zu suchen, der wirklich herausragende Ergebnisse in allen Zeitebenen liefert? Suchen Sie nicht weiter! Der Miraculous Forex Indikator ist da, um Ihre Trading-Erfahrung zu revolutionieren und Ihre Gewinne auf neue Höhen zu bringen. Basierend auf modernster Technologie und jahrelanger sorgfältiger Entwicklung steht der Miraculous Forex Indikator als Höhepunkt v
TrendMaestro
Stefano Frisetti
5 (2)
note: this indicator is for METATRADER4, if you want the version for METATRADER5 this is the link: TRENDMAESTRO recognizes a new TREND in the bud, he never makes mistakes. The certainty of identifying a new TREND is priceless. DESCRIPTION TRENDMAESTRO identifies a new TREND in the bud, this indicator examines the volatility, volumes and momentum to identify the moment in which there is an explosion of one or more of these data and therefore the moment in which prices have strong probability of f
Indicator : RealValueIndicator Description : RealValueIndicator is a powerful tool designed specifically for trading on the EURUSD pair. This indicator analyzes all EUR and USD pairs, calculates their real currency strength values, and displays them as a single realistic value to give you a head start on price. This indicator will tell you moves before they happen if you use it right. RealValueIndicator allows you to get a quick and accurate overview of the EURUSD currency pair tops and bottoms,
Candle Power Pro
Thushara Dissanayake
4.33 (6)
Nutzen Sie die Kraft echter Volumeninformationen mit dem   Candle Power Pro-   Indikator. Dieses dynamische Tool erfasst die tatsächlichen Volumendaten für jede Kerze und stellt sie als Prozentsatz des Gesamtvolumens dar. Auf diese Weise können Sie den anhaltenden Kampf zwischen Käufern und Verkäufern auf dem Markt erkennen. Candle Power Pro zeigt den Kampf zwischen Käufern und Verkäufern als Prozentsatz des Gesamtvolumens an und gibt Ihnen wertvolle Einblicke in die Marktdynamik. Sie können Aus
Market Breaker Updated version 3
Allistair Kabelo Mandow
1 (1)
Features for software Main functions: Accurate entry signals WITHOUT REPAINTING! Once a signal appears, it remains valid! This is a significant distinction from repainting indicators that might provide a signal and then alter it, potentially leading to deposit losses. Now, you can enter the market with higher probability and precision. There's also a function to colour candles after an arrow appears until the target (take profit) is reached or a reversal signal appears . Display of STOP LOSS
Weis Wave with Alert
Trade The Volume Waves Single Member P.C.
4.79 (19)
Rental/Lifetime Package Options and Privileges' * For optimum results the yearly or lifetime package is suggested due to live training and Discord  channel trading with the  creator! Rent Monthly Six Months   Yearly/Lifetime Weis Wave with Speed with Alert+Speed Index x x x Manual  x x x Quick Set up Video x x x Blog x x x Lifetime Updates x x x Setup and Training Material x x Free Rectangle Break Alert Tool      x Discord Access Channel "The SI traders" x 2-hour live methodology traini
System Trend Pro - This is the best trend trading indicator!!! The indicator no repaint!!!   The indicator has   MTF   mode, which adds confidence to trading on the trend (   no repaint   ). How to trade? Everything is very simple, we wait for the first signal (big arrow), then wait for the second signal (small arrow) and enter the market in the direction of the arrow. (See screens 1 and 2.) Exit on the opposite signal or take 20-30 pips, close half of it, and keep the rest until the oppo
Full STO
Roman Smoroda
Vollständiger STO-Indikator (enthält alle Versionen der drei STO-Indikatoren: Premium, Gold, Silver) - STABLE TRADE OPTION ist für den automatischen Handel mit binären Optionen konzipiert.  VORSICHTIG LESEN!!!!! WICHTIG Erstellen Sie in einem Terminal zwei Vorlagen mit unterschiedlichen Verfallzeiten, eine Vorlage für 18:01, 18:02 mit Verfallzeiten von 1 bis 15 Minuten und eine Vorlage für 22:00 mit Verfallzeiten von 10 bis 20 Minuten. Gewinnrate: 71% in den letzten 5 Jahren Geldverwalt
Idea: RSI ( Relative Strength Index) and CCI ( Commodity Channel Index ) are powerfull to solved the market.  This indicator has Smoothed Algorithmic signal of RSI and CCI. So that, it separates the market into buy and sell zones, these areas are marked with arrows, red for downtrend, green for uptrend. This algorithm has the effect of predicting the next trend based on the historical trend, so users need to be cautious when the trend has gone many candles. Please visit screenshots
DESCRIPTION The CHAOS INDICATOR has been developed to be used for the TRADING STRATEGY OF CHAOS, as described in the book. The book is in italian language only and can be obtained only on my website indicated below. DATAS COLLECTED AND SHOWN ON GRAPHS The CHAOS INDICATOR apply easily to any graph and any asset, and it is a TRADING FACILITATOR, as it identify immediately the following items on any graph: - The GP (= RIGHT PRICE) i.e. the price to which the asset should be attracted within 24
Gann Swing Structure
Kirill Borovskii
5 (1)
This indicator is based on the mathematics of the great trader W.D. Ganna. With its help, you can easily find strong levels by analyzing swings to find the optimal entry point. The indicator works on all instruments and all timeframes. The indicator is fully manual and has control buttons. All you need to do is press the NEW button, a segment will appear, which you can place on any movement, swing or even 1 candle that you want to analyze. By placing the segment, press the OK button. A grid (th
Gann Zone Pro
Kirill Borovskii
This indicator identifies and displays zones, as it were areas of strength, where the price will unfold. The indicator can work on any chart, any instrument, at any timeframe. The indicator has two modes. The indicator is equipped with a control panel with buttons for convenience and split into two modes. Manual mode: To work with manual mode, you need to press the NEW button, a segment will appear. This segment is stretched over the movement and the LVL button is pressed. The level is displayed
Full Forex Market View Dashboard
Opengates Success International
5 (2)
VOLLSTÄNDIGE FOREX-MARKTANSICHT Dashboard-Anzeige Dies ist ein benutzerdefinierter Indikator, der erstellt wurde, um Händlern einen vollständigen Überblick darüber zu geben, was auf dem Markt vor sich geht. Es verwendet Echtzeitdaten, um auf den Markt zuzugreifen und alle Informationen anzuzeigen, die für einen erfolgreichen Handel erforderlich sind. INSTALLATION: Bevor Sie diesen Indikator an Ihren Fenster-Chart anhängen, gehen Sie zum Market Watch Panel Ihres MT4 und AUSBLENDEN Sie al
The indicator is designed to work on any trading platform. The program is based on proprietary algorithms and W.D.Ganna's mathematics, allowing you to calculate target levels of price movement based on three points with the highest degree of certainty. It is a great tool for stock trading. The indicator has three buttons: NEW - call up a triangle for calculation. DEL - delete the selected triangle. DELS - completely remove all constructions. The probability of achieving the goals is more than 80
EZT Trend
Tibor Rituper
4 (1)
Der EZT-Trendindikator zeigt Ihnen den Trend, den Rückzug und die Einstiegsmöglichkeiten. Optionale Filterung und alle Arten von Warnungen sind verfügbar. E-Mail- und Push-Benachrichtigungsbenachrichtigungen werden hinzugefügt. Wir entwickeln auch einen EA basierend auf diesem Indikator, der bald verfügbar sein wird. Es handelt sich um einen multifunktionalen Indikator, der aus zwei Farbhistogrammen und einer Linie besteht. Es handelt sich um eine visuelle Darstellung der Richtung und Stärke
IA Trendx3 PRO
Marco Aurelio Santos Costa
What if God Created a Trade System? No miracles... Just see how mathematics can be effective in the market. We managed to combine technical analysis / price action into indicators, creating the best setup for trading, be it in Forex, Indices, or stocks. It took us 2 years to create something that really works, and now it's time for you to discover it. TrendX3 is a revolution in trend analysis. Based on advanced algorithms and real-time data, it provides valuable insights so that you can make inf
This is a trend Predictor. Honestly I have to give some credit to some few developers I know personally because they helped pulled this off.  The trend indicator uses special optics to direct the flow of price . it detects where the trend is moving into  It uses price action and a few other embedded custom indicator. You can use it in all timeframes and will be available at a much cooler price.  Please test this Indicator before buying to make sure you like what you see. I can't guarantee th
The breakout algorithm is a technique based on price, price features, to shape a breakout strategy. The strategy in this indicator will not be redrawn (none-repaint indicator), it is suitable for short or long term traders In the screenshot is the EURUSD pair, these currency pairs, commodities or stocks, it have similar strength *Non-Repainting (not redrawn) *For Metatrader4 Only *Great For Scalping *Great For Swing Trading *Arrow Entry, Green is Long, Red is Short *Works On Any Timeframe *Work
Wenn Sie oft Trades verlieren, weil Sie nur einen Indikator verwenden, dann probieren Sie dieses Handelstool aus. Dieses Handelstool verwendet mehr als einen Indikator. Ich beobachte oft Händler, die nur den RSI-Indikator verwenden. Sehr oft ist der Markt überverkauft, aber immer noch im Minus, oder der Markt ist überkauft, aber immer noch im Plus. Aus diesem Grund müssen Sie mehr als einen Indikator verwenden. Wir stellen die neue Version V 3.40 MTF PPAAF vor: Multi Time Frame Precise Price Ac
Market Breaker Pro
Allistair Kabelo Mandow
PYTHONFX INCEPTION TRADING SYSTEM THE BROKERS WORST NIGHTMARE... IMPORTANT! After the purchase please send me a private message to receive the installation manual and the setup instructions. We proudly introduce the PYTHONFX ROYAL CIRCLE Inception trading system, your key to financial freedom.   This is the brokers worst nightmare. Seriously! Modern market conditions require modern solutions & if you are still struggling to analyse the charts and struggling to find consistency in the
"Dragon's Tail" is an integrated trading system, not just an indicator. This system analyzes each candle on a minute-by-minute basis, which is particularly effective in high market volatility conditions. The "Dragon's Tail" system identifies key market moments referred to as "bull and bear battles". Based on these "battles", the system gives trade direction recommendations. In the case of an arrow appearing on the chart, this signals the possibility of opening two trades in the indicated directi
SMCpro VIP MT4  Original Price  $620   ---  Currently Price 20% OFF ( for unlimited use )   BONUS  AUX VIP Club 2024 : Include  EA Airbag  and  Load Data History  to enhance the performance of this tool to its maximum potential  Click Here to Download Files   ( for users only )   Hello World! Introducing.. SMCpro VIP tool and Indicator for MetaTrader 4, designed to revolutionize your trading experience with the ICT Smart Money Concept. This system is meticulously crafted to empower trad
PZ Harmonacci Patterns
PZ TRADING SLU
3.43 (7)
Dies ist wahrscheinlich der vollständigste Indikator für die automatische Erkennung der harmonischen Preisbildung, den Sie für die MetaTrader-Plattform finden können. Es erkennt 19 verschiedene Muster, nimmt Fibonacci-Projektionen genauso ernst wie Sie, zeigt die potenzielle Umkehrzone (PRZ) an und findet geeignete Stop-Loss- und Take-Profit-Werte. [ Installationsanleitung | Update-Anleitung | Fehlerbehebung | FAQ | Alle Produkte ] Es erkennt 19 verschiedene harmonische Preisbildungen Dar
Intro to APAMI, PROfessional edition Trace exactly how far prices trend between two price levels with fractional pip precision, while qualifying price movement between the same price levels. Completely automate when trends change direction and volatility, without any lag .  This is possible because the Accurate Price Action Measurement Indicator (APAMI) actually does what no other indicator can:  measure price distance between two points and simultaneously qualify the price action that occurs
The Stochastic Basket Currency Strenght  brings the Stochastic indicator to a new level.  Expanding the boundaries of TimeFrames and mono-currency analysis, the SBCS take the movements of each currency that composes the cross and confront them in the whole basket of 7 crosses.  The indicator works with any combination of AUD, CAD, CHF, EUR, GBP, JPY, NZD, USD pairs and with full automation takes in account every stochastic value (main line) for the selected Time Frame.  After that, the indicator
Fnix l long position
Monique Ellen Miranda Dos Santos
Sind Sie als Investor auf der Suche nach langfristigen Möglichkeiten auf dem Finanzmarkt? Ich präsentiere Ihnen den benutzerdefinierten Langzeit-Trendindikator. Dieser Indikator ist für Trader konzipiert, die Positionen auf längeren Zeiträumen als täglichen, wöchentlichen und monatlichen Charts handeln möchten. Mit klaren und präzisen Signalen erhalten Sie die Unterstützung, die Sie benötigen, um fundierte Entscheidungen zu treffen. Hauptmerkmale: Langzeitstrategie: Dieser Indikator eignet sich
Daotradingfx
Huynh Cong Chinh
"Daotradingfx - Der perfekte Schlüssel für Wellenhandel mit 7 Jahren Erfahrung" Der Devisenhandel ist niemals einfach, aber mit dem Daotradingfx-Indikator habe ich einen zuverlässigen Partner gefunden, der die Tür zum Erfolg im Wellenhandel öffnet. Dieser Indikator wurde auf der Grundlage meiner 7-jährigen Handelserfahrung entwickelt und ist nicht nur ein Werkzeug, sondern eine umfassende Darstellung des Marktverständnisses und der Benutzerfreundlichkeit beim Handeln. Daotradingfx sticht d
The Nihilist 5.0 Indicator includes Forexalien and Nihilist Easy Trend trading strategies and systems. It is composed of an MTF Dashboard where you can analyze the different input possibilities of each strategy at a glance. It has an alert system with different types of configurable filters. You can also configure which TF you want to be notified on your Metatrader 4 platform and Mobile application The indicator has the option to view how could be a TP and SL by using ATR or fixed points, even
Introducing the "Magic Trades" for MetaTrader 4 – your ultimate tool for precision trading in dynamic markets. This innovative indicator revolutionizes the way you perceive market trends by harnessing the power of advanced analysis to detect subtle changes in character, paving the way for optimal trading opportunities. The Magic Trades Indicator is designed to empower traders with insightful entry points and well-defined risk management levels. Through its sophisticated algorithm, this indica
Trend Flasher Trend is your friend is the age old saying quote in trading arena, there are though many ways to gauge the trend and its direction, more scientific measure and logically meaningful will be an ATR break outs to identify and spot the trend and its acceleration, so we created this easy to use trend identification panel and optimized super trend based multi time frame panel entry system to aid and help the traders to make their trading decision. Unique Features of Trend Flasher 1
Weitere Produkte dieses Autors
Dinge zu tun und zu handeln ist zeitsensibel, geographisch und menschenfreundlich.Normalerweise kümmern wir uns meistens nur darum, welchen Preis wir eine Position eröffnen, welchen Preis, um Verluste zu stoppen, und welchen Preis, um Gewinne zu stoppen, das heißt geographischer Vorteil.Es wird wenig darauf geachtet, wann man eine Position eröffnet, Verluste stoppt und Gewinne stoppt, die man Tianshi nennt. Dieser Indikator kann Ihnen helfen herauszufinden, wann Sie handeln, wann Sie
Auswahl:
Keine Bewertungen
Antwort auf eine Rezension
Version 1.6 2019.08.09
Laden Sie die Fehlerdatei in der vorherigen Ausgabe hoch.
Version 1.4 2019.08.09
1.Die früheren Probleme wurden korrigiert.


2.Fügt Anzeige Wave -Nummern hinzu.
Version 1.3 2019.07.31
Das Problem, dass die berechnete Drucklinie nach Netzunterbrechungen verschwindet, wird optimiert.
Version 1.2 2019.07.27
Ich habe mich verändert und war deprimiert.
Version 1.1 2019.07.27
1. Auf der Grundlage der ersten Ausgabe ist sie leicht verändert und genauer.

2. Entfernen Sie die höchsten und niedrigsten Punkte und lassen Sie nur Druck und Unterstützung.