Average Daily Range Board
- Indikatoren
- Version: 1.1
- Aktualisiert: 12 März 2020
- Aktivierungen: 5

Average Daily Range mit Faktorziel und weiteren Funktionen (ADR)
Hallo Trader,
Das aktualisierte ADR Dashboard ist viel besser und bequemer für Daytrader, probieren Sie es aus, um die guten Dinge zu erleben!
Wie benutzt man den Average Daily Range (ADR) Indikator?
ADR ist nur ein einfaches Indikator-Tool, das dem Händler hilft, die durchschnittliche tägliche Spanne eines Instruments zu identifizieren. So haben wir zum Beispiel das Paar EURUSD und das Paar macht in der Regel einen Höchst- und Tiefstwert während des Handelstages und der Punkt vom Tiefstwert bis zum Höchstwert dieses Handelstages schafft eine Spanne für diesen Tag, in der sich das Paar in der Regel innerhalb dieser Spanne bewegt, z.B. 80 Pips (800 Punkte, so gezählt mit der fünften Stelle), und der Abstand von diesen beiden Punkten vom Tiefstwert bis zum Höchstwert wird in Punkten gemessen; Wir haben diesen Indikator auf der Grundlage der Idee des benutzerdefinierten ATR-Indikators erstellt, aber wir illustrieren die Produkte auf einem Dashboard mit Ziffern, um sie zu sehen; außerdem fügen wir die Funktionen hinzu, um Zeiträume in Tagen als Durchschnitt zu berechnen und auch die Alarmfunktionen, die dem Händler eine Benachrichtigung senden, dass der durchschnittliche Tagesbereich dieses Instruments ausgelöst wurde. Die Darstellung auf dem Dashboard und deren Berechnung helfen dem Daytrader, sich schnell ein Bild davon zu machen, wie viele Pips die Instrumente noch nach oben/unten für den Handelstag bewegen können.
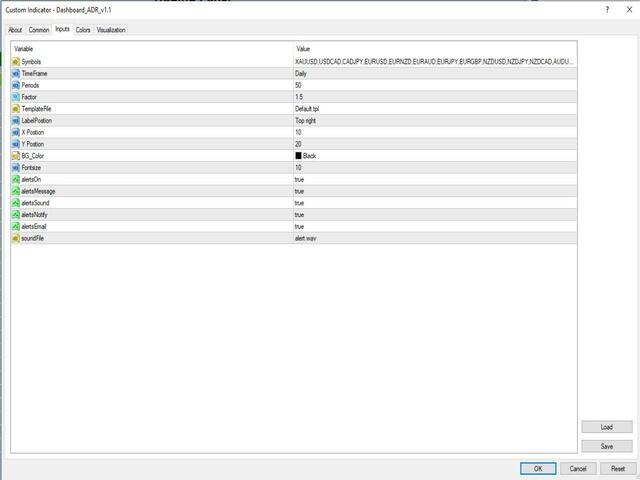
ADR-Einstellungen
- Zu setzende Symbole, jedes Symbol muss mit einem Semikolon getrennt werden
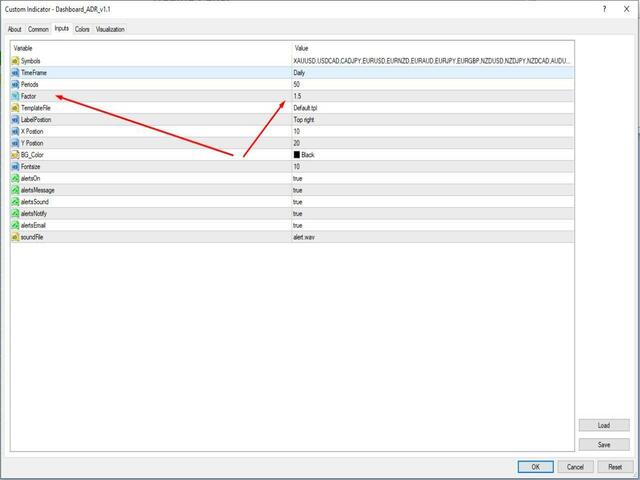
- Zeitraum: Geben Sie die Zahl des Tages ein, 1= eintägige Durchschnittsberechnung, 2= zweitägige Durchschnittsberechnung und so weiter...
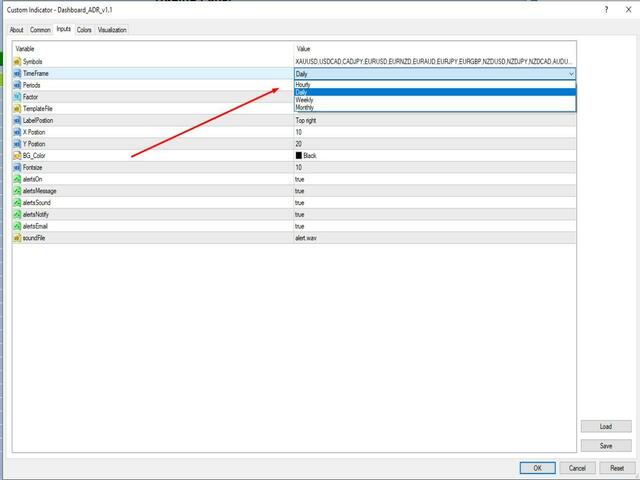
- Zeitrahmen: Stündlich, Täglich und Wöchentlich, die den Bereich der Stunden von der aktuellen Kerze bis zu den eingestellten Zeiträumen messen, z.B.: Wählen Sie stündlich und geben Sie 5 ein, bedeutet dies, dass ein Bereich von 5 Stunden gemessen wird. Das Gleiche gilt für täglich und wöchentlich. Probieren Sie es aus, um Erfahrungen zu sammeln.
- Faktor: Das bedeutet, dass ein bestimmter durchschnittlicher Zeitraum der Spanne kann zusätzlich Ziel Faktor, den Sie bevorzugen; zum Beispiel: Durchschnitt der täglichen Spanne für EURUSD für 50 Perioden des Tages wäre 100 Pips, setzen Sie Faktor 1,5 dann Ihr Ziel wird 150 Pips zu senden Alarm.
- Klicken Sie auf das Symbol: Klicken Sie auf dem Dashboard einfach auf das Symbol, es wird Sie zum Chart dieses Symbols führen / das Chartfenster dieses Symbols öffnen. Probieren Sie es einfach aus, um Erfahrungen zu sammeln.
- Positionseinstellungen: Sie können das Dashboard in die von Ihnen gewünschte Ecke des Chartfensters setzen.
- BG: Wählen Sie Ihre eigene Hintergrundfarbe
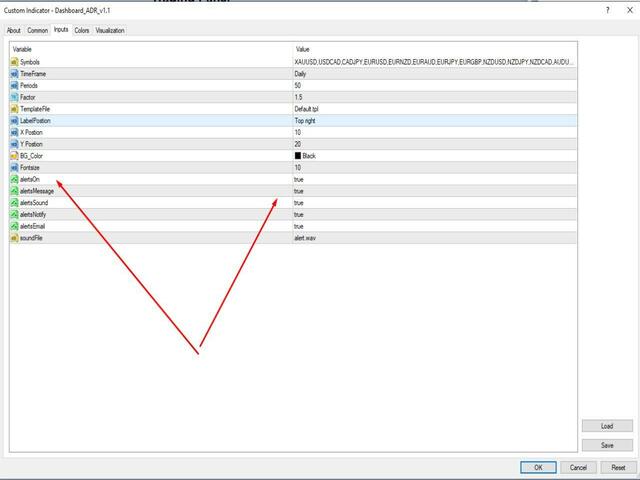
- Warnungen: An/aus
Optionen für Warnungen und Benachrichtigungen
- Pop-up-Meldungen anzeigen - Setzen Sie "wahr", um Pop-up-Benachrichtigungen zu erhalten
- E-Mail senden - Setzen Sie "wahr", um eine Benachrichtigungs-E-Mail zu erhalten
- Mobile Benachrichtigungen senden - Legen Sie "wahr" fest, um mobile Benachrichtigungen zu erhalten
- Warnton abspielen - Legen Sie "wahr" fest, um eine akustische Benachrichtigung zu erhalten
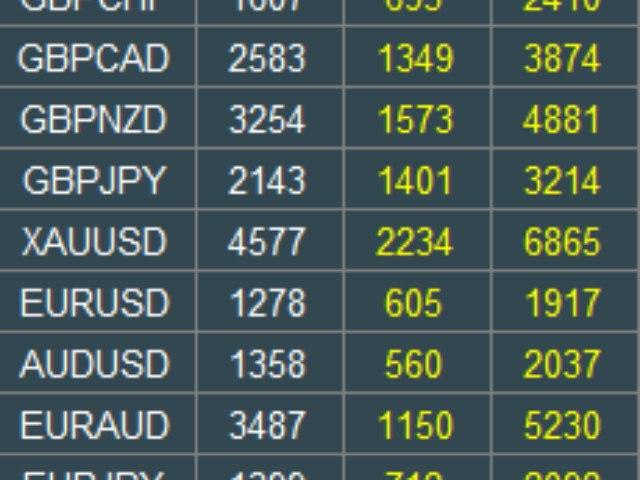
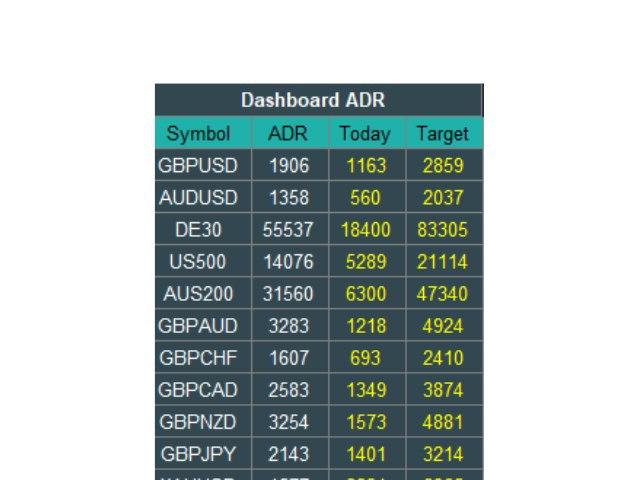
Anzeige im Diagramm
Dashboard mit
- Name des Symbols
- Durchschnittlicher Bereich
- Heute hat sich in XYZ Punkten bis jetzt bewegt
Fröhliches Handeln!
Handelsszenen


Der Benutzer hat keinen Kommentar hinterlassen