• Aperçu
  • Avis
  • Commentaires (2)

Alpha Bands

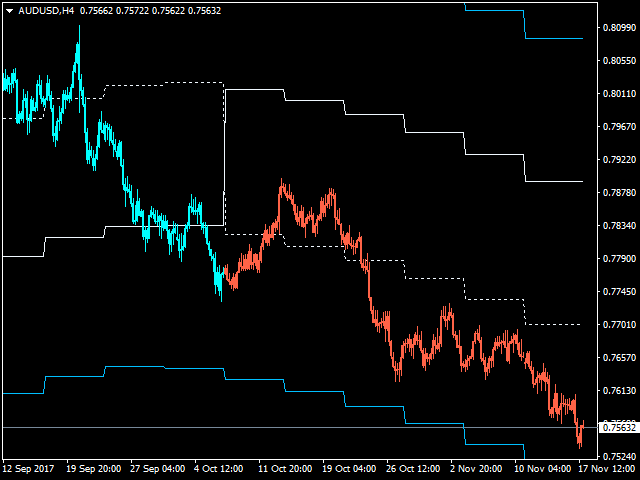
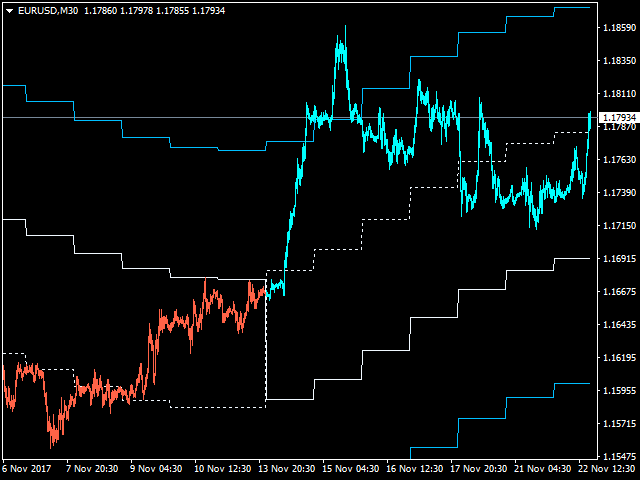
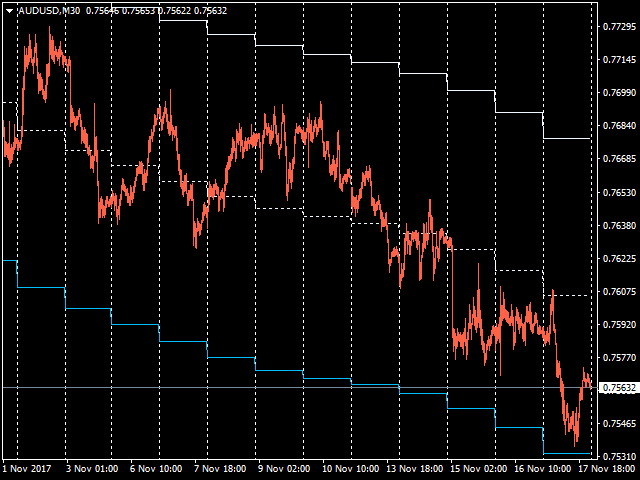
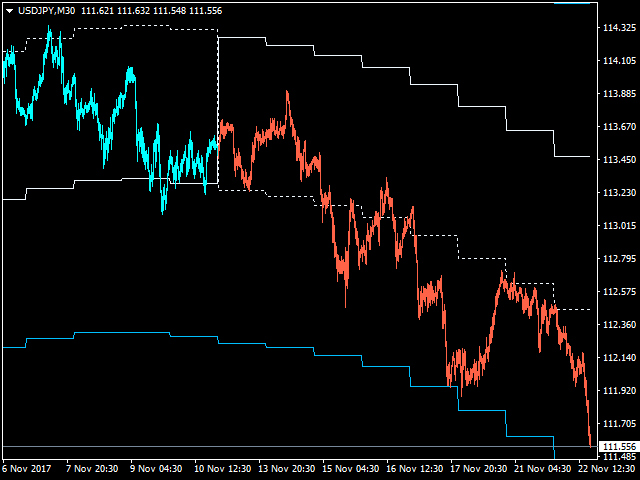
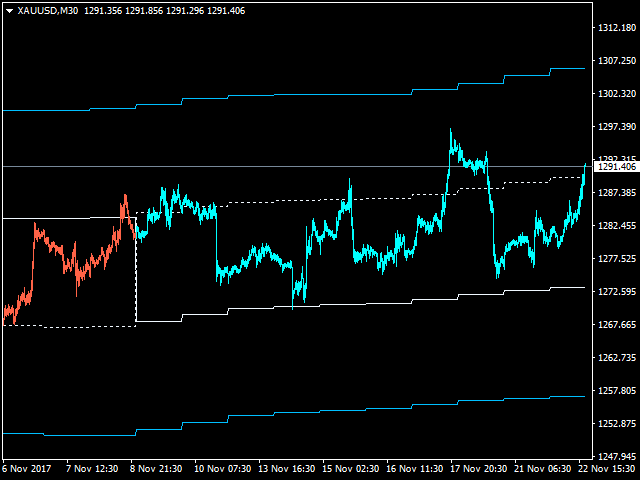
This indicator shows the main trend on the current chart.


Features

  • This indicator includes two bands, one is the inner white bands, another is the outer blue bands.
  • If the white dotted line crosses down the white solid line, this means that the trend has changed to be bearish.
  • If the white dotted line crosses up the white solid line, this means that the trend has changed to be bullish.
  • Once the crossing happened, it will not repaint.


Settings

  • ShowColorCandle: if 'true', it will show the color candle.
  • BullColor: the color of candle in bullish market (default is clrAqua).
  • BearColor: the color of candle in bearish market (default is clrTomato).


Usage

Enter the market when the price is in the inner bands. If the price reached outer bands, order should be closed.

The key of trading is to select the proper timeframe. Of course, you may create your strategy based on this indicator.

Produits recommandés
No idea why demo is not working. you can check the GIF to see how it works. Features With this scanner you can detect Candles which are below/above yesterday high/low lines. A pair's rectangle turns RED in dashboard if it is above the yesterday high, and rectangle turns GREEN in dashboard if it is below the yesterday low. It gives alerts in every 15m candle close. Contains a Dashboard which will help you to see all market pair's. It is possible to disable this sorting through to make it easie
Multi Indicators Scanner Indicator Scan  ADX ,Moving Average ,ENVELOPE ,SAR , MACD ,RSI  and ATR . We can change all input parameters in chart window. scanner works Multiple Time Frame we can change Timeframe .  Symbol button based on Trend color , we can click button and open chart .  We can also save templates in input.   Default settings Time Frame   1Hour Templates Name  Default Auto Arrange Chart  true
A useful scanner/dashboard that shows the RSI values for multiple symbols and time-frames. It can be easily hidden/displayed with a simple click on the scanner man top left of the dashboard. You can input upper and lower RSI values and the colours can be set to show when above/below these values. The default values are 70 and 30. There are also input colours for when the RSI is above or below 50 (but not exceeding the upper/lower levels Symbols and time-frames are input separated by comma
TrendPlus
Sivakumar Subbaiya
4.21 (14)
Trend Plus   Trendplus  Indicator   Time Frame: Suitable for any time frame.  Purpose: Trend Prediction. Blue and red candle indicate the buy and sell call respectively. Buy: When the blue candle is formed buy call is initiated. close the buy trades when the next red candle will formed.   Sell: When the Red candle is formed Sell call is initiated. close the Sell trades when the next blue candle will formed.   Happy trade!!
FREE
The Best Choice compra y venta
Sandro Israel Hernandez Zamora
¿Has escuchado decir que la tendencia es tu amiga? pues nada es mas cierto en el mundo del trading. Este indicador analiza las tendencias y su fuerza para que puedas aprovecharlas y utilizamos un conjunto de indicadores como RSI, %W, MACD y EMAS para analizar el mercado y sus movimientos, por lo que podrás mantener tu gráfico limpio sabiendo que todos estos indicadores los tienes en uno solo. Este, como cualquier indicador, no representa una certeza de compra o venta definitiva, por lo siempre r
Heikin Ashi Premium
Frederick Langemark
5 (13)
Heikin Ashi is Japanese for "average bar", and may make it easier for you to identify trends. Our version of this popular indicator adjusts the size of the candles based on the zoom level of your chart, making it appear more naturally just like the traditional candlesticks. The colors are selected based on the color scheme you use on your charts, but can be customized anyway you would like. You may also choose whether to display only the Heikin Ashi candles, or show the other selected chart as w
FREE
Fluctuation Bands
Francisco De A Vilar Enriquez
Shows the price fluctuation bands associated with a moving average. It is extremely accurate, and it's a wonderful visual guide. The indicator consists of 4 bands . The two bands closest to the price form the fluctuation channel , they mark the maximum calculated deviation of the price from the moving average. The outer bands mark the maximum overdeviation of the price with respect to the fluctuation channel, they are overbought or oversold areas. Features.  -The change of periods of the MA is d
MegaTrends
Sivakumar Subbaiya
1 (1)
Megatrends  Indicator   Time Frame: Suitable for any time frame.  Purpose: Trend Prediction. Blue and red color indicate the buy and sell call respectively. Buy: When the blue line is originating it is opened buy call. Sell: When the Red line is origination it is opened sell call Happy trade!! this indicator is suitable for all time frame, but our recommended time frame to use 1hour and 4 hours, suitable for any chart.
FREE
Chart Analyzer
Innovicient Limited
The Chart Analyzer is an MT4 indicator that provides visual arrow signals without redrawing them. In addition, we have included trendlines to validate your entries. This indicator has been fine-tuned to work with all timeframes and instruments.  The Chart Analyzer has a number of advantages Does not fade or remove arrows when drawn Sends both email and phone alerts. It is light on computer resources Easy to install. Default setting works just fine.  If price opens above the trendline, open
ZhiBiTMG
Qiuyang Zheng
ZhiBiTMG is a collection of trends and martingale indicators for all market segments and all chart cycles. Many indicators on the market violate the trend but claim to be accurate, but is it really accurate? In fact, it is not accurate! Because the market must go with the trend. This ZhiBiTMG indicator gives the Martingale signal on the premise of the trend. This will be in line with market rules. Instructions for use: The red line is the downward trend line (Sell), a total of three lines; by de
Essential Trader
Innovicient Limited
The Essential Trader indicator pinpoints the important entry areas for any trading instrument you through at it. This indicator is more comfortable with whipsaw/ranging market conditions. It is not a complicated trading indicator and can be used on any timeframe with high level of confidence. Besides, it has notifications and alerts. The dotted essential points show spots where you can make immediate entries and benefit from breakout on either side of the region. On the other hand, the color fil
Discrete Line AM
Andriy Matviyevs'kyy
The presented indicator allows you to visualize the direction of the trend while cutting off minor price fluctuations. The indicator's customizable parameter (Filter) determines the number of points for the current financial instrument that the indicator cuts off in the process of determining the trend. Despite its simplicity, the indicator can be useful for both beginners and experienced traders. The indicator marks trend reversal points and can send notifications of such signals to the termina
FREE
Three Line Strike Finder
Thomas Christopher Johnson
The three line strike pattern, which consists of three bullish or bearish candles, and a fourth candle that is larger than the previous three in the opposite direction, can be traded many ways.  This indicator simply highlights those previous trades, and then pushes out targets in the direction of the last candle. Advantages of three line strike The three line strike can be traded as part of a bullish and bearish engulfing pattern, 2 bar reversal set up and n-Bar rallies and declines. How it
HeikenashiSmoothing
Rodolfo Leonardo De Morais
Heiken ashi Smoothing in separate window MTF The color of the Heiken-Ashi candles depend on their shadows. The advantage of the Heiken-Ashi chart is that the trend is determined very simply, the upward-facing sails are blue, and the downward-tendency sails are red. For profitable trading it is necessary to use it with the standard candles (make analyzes) and with the other indicators. Indicator Parameters TimeFrame - Graphic time being 0 = Current graph time, 1 = M1, 5 = M5, 15 = M15, 30 = M30
Arrow indicator, to determine adjustments and local trends The arrow appears on the current bar and after closing the bar will not disappear. Allows you to enter the transaction at the very beginning of the movement Thanks to the flexible settings you can use on any currency pairs, metals and cryptocurrency Can be used when working with binary options Distinctive features Does not redraw. Additional parameters for fine tuning. Works on all timeframes and symbols. Suitable for trading c
Note : The slow loading of the indicator issue has been addressed . This new version loads fast and does not slow the platform. Version 1.3 : We have updated the indicator to include an historical bar scanning option . So instead of scanning all bars in the history (which can make the indicator slow sometimes ) , you can select the maximum number of bars it can scan which can increase the performance and make the indicator faster. This indicator scans the 1-3 Trendline pattern . The indic
Free automatic Fibonacci is an indicator that automatically plots a Fibonacci retracement based on the number of bars you select on the BarsToScan setting in the indicator. The Fibonacci is automatically updated in real time as new highest and lowest values appears amongst the selected bars. You can select which level values to be displayed in the indicator settings. You can also select the color of the levels thus enabling the trader to be able to attach the indicator several times with differe
FREE
This powerful tool combines the Zigzag algorithm with Fibonacci retracement levels, enhancing your trading experience in the MetaTrader 4 (MT4) platform. Zigzag with Fibo Indicator Time Frame :- 1H and above The   Zigzag with Fibo Indicator   is designed to identify trend direction and provide precise entry and exit points for forex trading. Here’s what makes it stand out: Zigzag Algorithm Integration : The indicator utilizes the Zigzag algorithm, which helps filter out market noise and highligh
FREE
Double PSAR AM
Andriy Matviyevs'kyy
This indicator is a modification of the classic Parabolic support and resist (PSAR) indicator. The indicator has two customizable ranges, which allows you to identify long-term and short-term trends. The indicator has the ability to generate signals and send notifications about them to email and the terminal. A time-tested product that allows you not only to determine entry/exit points, but also reasonable levels for placing protective stop orders.
FREE
Growing Bands Sh
Nikolay Likhovid
3 (2)
Do you use dynamic ranges (like Bollinger Bands or Envelopes) in your trading? A fixed period is usually used for such calculations. But is such approach relevant to the very nature of the market? In fact, the price chart consists of a series of successive processes - trends and flats. In this case, we can talk about the internal development logic inside a single process only. Therefore, the nature of the market is better described by dynamic ranges designed for the processes occurring "here and
FREE
Description Better version of RSI indicator which offer a complete visual trading strategy and realize an auto-optimization Support:   We create great tools for the entire trading community. Most of them are free. If you believe in what we do  Support Us Here.   KEY LINKS:   How to Install  –  Frequent Questions  -  All Products  How is this indicator useful? NEVER repaints. Detect best parameters of RSI indicator, based on profit factor during the specified period. This indicator can be used as
FxSProMT
Sergiy Podolyak
4 (3)
The FxSProMT indicator shows the current market trend and trend change. Indicator Parameters Ind_Period - the number of previous bars used to calculate actual values. Number_Bars - the number of bars to display the indicator.. Too many bars may significantly slow down the operation of the trading terminal. Signal_Sound - sound alert to notify of trend change. The sound can be played multiple times until the signal is confirmed (the bar closes). Default is disabled. Signal_Alert - an alert to n
FREE
Victorias
Andriy Sydoruk
Victoria is a trend indicator used to identify trends in financial markets, indicates the direction of price movement. Flexible indicator settings allow you to receive more accurate signals for opening positions. The indicator will allow you to determine the current trend. Using this algorithm, you can quickly understand what kind of trend is currently developing in the market. Victoria can be used along with oscillators as a filter. Victoria is a true range indicator that identifies the ra
Signal Arrows is an indicator that generates trade arrows. It generates trade arrows with its own algorithm. These arrows give buying and selling signals.  Can be used in all pairs. Sends a signal to the user with the alert feature. The indicator certainly does not repaint. Trade rules Enter the signal when the buy signal arrives. In order to exit from the transaction, an opposite signal must be received. It is absolutely necessary to close the operation when an opposite signal is received. Th
The indicator allows you to trade binary options. The recommended time frame is М1 and the expiration time is 1,2,3 minutes. The indicator suitable for auto and manual trading. A possible signal is specified as a arrows above/under a candle. You should wait until the candle closes! Arrows are not re-painted Trade sessions: TOKYO section (Half-end) Currency pairs: USD/JPY Working time frame: M1 Expiration time: 1,2,3 minutes. The indicator also shows good results when using the martingale strateg
FREE
OrderBlock TS Roman
Vladislav Vlastovskii
4 (7)
Индикатор строит блоки заказов (БЗ) по торговой системе (ТС) Романа. Поиск блоков осуществляется одновременно на двух таймфремах: текущем и старшем (определяемым в настройках). Для оптимизации и игнорирования устаревших блоков в настройках задается ограничение количества дней в пределах которых осуществляется поиск блоков. Блоки строятся по правилам ТС состоящем из трех шагов: какую свечу вынесли (что?); какой свечой вынесли (чем?); правило отрисовки (как?).
FREE
Diamonds Min5   - DM5-   DM5    is an indicator that suggests entering levels (sell or buy) ,it always follow the trends using parabolic sar ,  working on is so easy, you need just to attach it to the chart and all the magic will show , this indicator does n ot repeat itself or redraw signals . After months of testing, it provides a very good result       it works on all pairs with no excaption 
Trend arrow Indicator
NGUYEN NGHIEM DUY
3.23 (13)
Trend arrow Indicator is an arrow Indicator used as an assistant tool for your trading strategy. The indicator analyzes the standard deviation of bar close for a given period and generates a buy or sell signals if the deviation increases. It good to combo with Martingale EA to follow Trend and Sellect Buy Only/Sell Only for EA work Semi-Automatic. You can use this  Indicator with any EAs in my Products.
FREE
This indicator shows the latest untouched support and resistance as horizontal lines. The indicator can show support/resistance from higher timeframes. With this indicator you can e.g. easily see the support/resistance of the timeframes H4, D1 and W1 on a H1 chart, which can be a big advantage while time your entry on H1. This is the FREE version of the indicator: Support Resistance Multi Time Frame The free version works only on EURUSD and GBPUSD! Parameters referenceTF: the timeframe from wh
FREE
Indicateur technique pour détecter de forts schémas d'action sur les prix : Pin Bar, Inside Bar et Outside Bar Introduction : Dans le domaine de l'analyse technique, les schémas d'action sur les prix servent d'indicateurs essentiels des mouvements potentiels du marché. Nous avons développé un indicateur technique sophistiqué qui simplifie l'identification de solides schémas d'action sur les prix sur les graphiques. Notre indicateur est spécialisé dans la détection de trois schémas essentiels : l
Les acheteurs de ce produit ont également acheté
Gann Made Easy
Oleg Rodin
4.96 (47)
Gann Made Easy est un système de trading Forex professionnel et facile à utiliser qui est basé sur les meilleurs principes de trading en utilisant la théorie de mr. WD Gann. L'indicateur fournit des signaux d'ACHAT et de VENTE précis, y compris les niveaux Stop Loss et Take Profit. Vous pouvez échanger même en déplacement en utilisant les notifications PUSH. S'il vous plaît contactez-moi après l'achat! Je partagerai avec vous mes astuces de trading et d'excellents indicateurs bonus gratuitement!
Atomic Analyst
Issam Kassas
5 (1)
Tout d'abord, il convient de souligner que cet indicateur de trading n'est ni repainting, ni redrawing et ne présente aucun délai, ce qui le rend idéal à la fois pour le trading manuel et automatisé. L'Analyste Atomique est un indicateur d'action sur les prix PA qui utilise la force et le momentum du prix pour trouver un meilleur avantage sur le marché. Équipé de filtres avancés qui aident à éliminer les bruits et les faux signaux, et à augmenter le potentiel de trading. En utilisant plusieur
ACTUELLEMENT 26% DE RÉDUCTION La meilleure solution pour tout débutant ou trader expert ! Cet indicateur est un outil de trading unique, de haute qualité et abordable car nous avons incorporé un certain nombre de caractéristiques exclusives et une nouvelle formule. Avec seulement UN graphique, vous pouvez lire la force de la devise pour 28 paires Forex ! Imaginez comment votre trading va s'améliorer parce que vous êtes capable de repérer le point de déclenchement exact d'une nouvelle tendan
Tout d'abord, il convient de souligner que cet outil de trading est un indicateur non repeint, non redessiné et non retardé, ce qui le rend idéal pour le trading professionnel. L'indicateur Smart Price Action Concepts est un outil très puissant à la fois pour les nouveaux et les traders expérimentés. Il regroupe plus de 20 indicateurs utiles en un seul, combinant des idées de trading avancées telles que l'analyse du trader Inner Circle et les stratégies de trading Smart Money Concepts. Cet in
Scalper Vault
Oleg Rodin
5 (27)
Scalper Vault est un système de scalpage professionnel qui vous fournit tout ce dont vous avez besoin pour un scalpage réussi. Cet indicateur est un système de trading complet qui peut être utilisé par les traders de forex et d'options binaires. Le délai recommandé est M5. Le système vous fournit des signaux fléchés précis dans le sens de la tendance. Il vous fournit également des signaux supérieurs et inférieurs et des niveaux de marché Gann. Les indicateurs fournissent tous les types d'alertes
TPSproTREND PrO
Roman Podpora
5 (15)
TPSpro TRENDPRO  - is a trend indicator that automatically analyzes the market and provides information about the trend and each of its changes, as well as giving signals for entering trades without redrawing! The indicator uses each candle, analyzing them separately. referring to different impulses - up or down impulse. Exact entry points into transactions for currencies, crypto, metals, stocks, indices!  -  Version MT5               DETAILED DESCRIPTION        /       TRADING SETUPS           
Trend Screener
STE S.S.COMPANY
4.83 (86)
Indicateur de tendance, solution unique révolutionnaire pour le trading et le filtrage des tendances avec toutes les fonctionnalités de tendance importantes intégrées dans un seul outil ! Il s'agit d'un indicateur multi-période et multi-devises 100 % non repeint qui peut être utilisé sur tous les symboles/instruments : forex, matières premières, crypto-monnaies, indices et actions. Trend Screener est un indicateur de suivi de tendance efficace qui fournit des signaux de tendance fléchés avec des
Actuellement 20% de réduction ! La meilleure solution pour tout débutant ou trader expert ! Ce logiciel de tableau de bord fonctionne sur 28 paires de devises. Il est basé sur 2 de nos principaux indicateurs (Advanced Currency Strength 28 et Advanced Currency Impulse). Il donne un excellent aperçu de l'ensemble du marché Forex. Il montre les valeurs de l'Advanced Currency Strength, la vitesse de mouvement des devises et les signaux pour 28 paires de devises dans tous les (9) délais. Imagine
Scalper Inside PRO
Alexey Minkov
4.75 (55)
SALE NOW! Limited Time Offer! An exclusive indicator that utilizes an innovative algorithm to swiftly and accurately determine the market trend. The indicator automatically calculates opening, closing, and profit levels, providing detailed trading statistics. With these features, you can choose the most appropriate trading instrument for the current market conditions. Additionally, you can easily integrate your own arrow indicators into Scalper Inside Pro to quickly evaluate their statistics and
Le profit de la structure du marché change à mesure que le prix s'inverse et recule. L'indicateur d'alerte d'inversion de la structure du marché identifie le moment où une tendance ou un mouvement de prix approche de l'épuisement et est prêt à s'inverser. Il vous avertit des changements dans la structure du marché qui se produisent généralement lorsqu'un renversement ou un recul majeur est sur le point de se produire. L'indicateur identifie initialement les cassures et la dynamique des prix,
TPSpro RFI Levels
Roman Podpora
5 (13)
A key element in trading is zones or levels from which decisions to buy or sell a trading instrument are made. Despite attempts by major players to conceal their presence in the market, they inevitably leave traces. Our task was to learn how to identify these traces and interpret them correctly. Reversal First Impulse levels (RFI)   -  Version MT5                INSTRUCTIONS                 RUS                 ENG                                       R ecommended to use with an indicator   -  
Présentation       Quantum Trend Sniper Indicator   , l'indicateur révolutionnaire MQL5 qui transforme la façon dont vous identifiez et négociez les inversions de tendance ! Développé par une équipe de traders expérimentés avec une expérience commerciale de plus de 13 ans,       Indicateur Quantum Trend Sniper       est conçu pour propulser votre parcours de trading vers de nouveaux sommets grâce à sa manière innovante d'identifier les inversions de tendance avec une précision extrêmement élevée
Quantum Breakout Indicator PRO
Bogdan Ion Puscasu
4.96 (26)
Présentation       Quantum Breakout PRO   , l'indicateur révolutionnaire MQL5 qui transforme la façon dont vous négociez les zones d'évasion ! Développé par une équipe de traders expérimentés avec une expérience de trading de plus de 13 ans,   Quantum Breakout PRO   est conçu pour propulser votre parcours de trading vers de nouveaux sommets grâce à sa stratégie de zone de discussion innovante et dynamique. Quantum Breakout Indicator vous donnera des flèches de signalisation sur les zones d
Advanced Supply Demand
Bernhard Schweigert
4.92 (310)
CURRENTLY 26% OFF !! Best Solution for any Newbie or Expert Trader! This indicator is a unique, high quality and affordable trading tool because we have incorporated a number of proprietary features and a new formula. With this update, you will be able to show double timeframe zones. You will not only be able to show a higher TF but to show both, the chart TF, PLUS the higher TF: SHOWING NESTED ZONES. All Supply Demand traders will love it. :) Important Information Revealed Maximize the potenti
Découvrez le secret pour réussir le trading Forex avec notre indicateur MT4 personnalisé! Vous êtes-vous déjà demandé comment réussir sur le marché du Forex, gagnant régulièrement des bénéfices tout en minimisant les risques? Voici la réponse que vous avez recherchée! Permettez-nous d'introduire notre indicateur MT4 propriétaire qui révolutionnera votre approche du trading. Polyvalence unique Notre indicateur est spécialement conçu pour les utilisateurs qui préfèrent les formations de bou
Présentation de l'indicateur miraculeux Forex : Libérez la puissance du trading précis En avez-vous assez de chercher le meilleur indicateur Forex qui fournisse réellement des résultats exceptionnels sur tous les délais ? Ne cherchez plus ! L'indicateur miraculeux Forex est là pour révolutionner votre expérience de trading et propulser vos gains vers de nouveaux sommets. Basé sur une technologie de pointe et des années de développement minutieux, l'indicateur miraculeux Forex se positionne comme
Break and Retest
Mohamed Hassan
5 (2)
Break & Retest is unstoppable when combined with our other divergence indicator. After purchase, send us a message and you could get this  2nd indicator  for  FREE  as a  BONUS! ‍You can visually backtest Break & Retest to see how it behaved in the past!    Manual guide:   Click here $59  for the first 25 copies ( 4  left)! Next price is $120 .  After many months of hard work and dedication, we are extremely proud to present you our  Break and Retest price action indicator crea
Entry Points Pro
Yury Orlov
4.7 (225)
Indicateur supérieur pour MT4 fournissant des signaux précis pour entrer dans un trade sans repeindre ! Il peut être appliqué à tous les actifs financiers : forex, cryptocurrencies, métaux, actions, indices.  La version MT5 est ici Il fournira des signaux de trading assez précis et vous dira quand il est préférable d'ouvrir un trade et de le fermer. Regardez la vidéo (6:22) avec un exemple de traitement d'un seul signal qui a rapporté à l'indicateur ! La plupart des traders améliorent l
Currency Strength Wizard est un indicateur très puissant qui vous offre une solution tout-en-un pour un trading réussi. L'indicateur calcule la puissance de telle ou telle paire de devises en utilisant les données de toutes les devises sur plusieurs périodes. Ces données sont représentées sous la forme d'un indice de devise facile à utiliser et de lignes électriques de devise que vous pouvez utiliser pour voir la puissance de telle ou telle devise. Tout ce dont vous avez besoin est d'attacher l'
TrendMaestro
Stefano Frisetti
5 (2)
note: this indicator is for METATRADER4, if you want the version for METATRADER5 this is the link: TRENDMAESTRO recognizes a new TREND in the bud, he never makes mistakes. The certainty of identifying a new TREND is priceless. DESCRIPTION TRENDMAESTRO identifies a new TREND in the bud, this indicator examines the volatility, volumes and momentum to identify the moment in which there is an explosion of one or more of these data and therefore the moment in which prices have strong probability of f
TrendDecoder Premium
Christophe, Pa Trouillas
5 (3)
Identifiez les ranges et les prochaines tendances fortes   |  Obtenez les premiers signaux et la force des tendances   |  Obtenez des TP clairs et RR favorable   |  Repérer les niveaux Fibo que le prix va tester Indicateur qui ne retrace pas, non retardé - idéal pour le trading manuel et automatisé - adapté à tous les actifs et à toutes les unités de temps Pour une durée limitée >>   -50% de réduction Après votre achat,   contactez-moi sur ce canal  pour obtenir les réglages recommandés. Version
ALERTE D'ACHAT ET DE VENTE MULTIDEVISES et MULTITIMEFRAME. AUTO TRAILING STOP ET RÉCOMPENSE DE RISQUE TAKEPROFIT ! L'INDICATEUR SCANNE ET ANALISE LE MARCHÉ POUR QUE VOUS N'AVEZ RIEN À FAIRE ! NÉGOCIEZ TOUTES VOS DEVISES SUR UN GRAPHIQUE !   Après l'achat veuillez laisser un commentaire, contactez-moi et je vous enverrai l'assistant commercial EA. L'indicateur utilise plusieurs oscillateurs et filtres associés pour trouver les meilleurs points d'entrée CONFIRMÉS afin que vous n'ayez pas à
FX Power MT4 NG
Daniel Stein
5 (8)
Obtenez votre mise à jour quotidienne du marché avec des détails et des captures d'écran via notre Morning Briefing ici sur mql5 et sur Telegram ! FX Power MT4 NG est la nouvelle génération de notre très populaire indicateur de force des devises, FX Power. Et qu'est-ce que ce compteur de force de nouvelle génération offre ? Tout ce que vous avez aimé de l'original FX Power PLUS Analyse de la force de l'OR/XAU Des résultats de calcul encore plus précis Périodes d'analyse configurables individuel
Trend Forecasting
Mohamed Hassan
5 (15)
Cet indicateur est très puissant lorsqu'il est combiné avec notre autre indicateur appelé Katana. Après l'achat, envoyez-nous un message et vous pourrez obtenir Katana GRATUITEMENT en BONUS  ! Le prix augmentera bientôt à 149$ ! Ne manquez pas le prix courant à 65$ ! L'indicateur de prévision de tendance est un outil très unique et simple qui est capable de prédire les mouvements futurs des prix en fonction des signaux générés par MACD. Cela vous aide à avoir une estimation des domaines dans
Price Action Entry Alerts
Stephen Sanjeeve Sahayam
5 (3)
Cet indicateur examine chaque barre pour la pression d'achat ou de vente et identifie 4 types de modèles de bougies avec le volume le plus élevé. Ces bougies sont ensuite filtrées à l'aide de plusieurs filtres linéaires pour afficher les signaux d'achat ou de vente. Les signaux fonctionnent mieux, en conjonction avec une direction temporelle plus élevée et lorsqu'ils sont négociés pendant les heures de volume élevé. Tous les filtres sont personnalisables et fonctionnent indépendamment. Peut aff
ACTUELLEMENT 31% DE RÉDUCTION ! ! La meilleure solution pour tout débutant ou Expert Trader ! Cet indicateur est un outil de trading unique, de haute qualité et abordable car nous avons incorporé un certain nombre de caractéristiques exclusives et une formule secrète. Avec seulement UN graphique, il donne des alertes pour les 28 paires de devises. Imaginez comment votre trading s'améliorera parce que vous serez capable de repérer le point de déclenchement exact d'une nouvelle tendance ou d'
FX Volume
Daniel Stein
4.6 (35)
Obtenez votre mise à jour quotidienne du marché avec des détails et des captures d'écran via notre Morning Briefing ici sur mql5 et sur Telegram ! FX Volume est le PREMIER et SEUL indicateur de volume qui fournit un VRAI aperçu du sentiment du marché du point de vue d'un courtier. Il fournit des informations impressionnantes sur la façon dont les acteurs institutionnels du marché, comme les courtiers, sont positionnés sur le marché des changes, bien plus rapidement que les rapports COT. Voir c
Up down v6T
Guner Koca
5 (1)
Thise indicator is up down v6  comes with tradingwiev version. purchased people, after installed on terminal ,contact me on mql5  to get BONUS  TradingView version. up-down indicator is no repaint and works all pairs and lower than weekly time frames charts. it is suitable also 1 m charts for all pairs. and hold long way to signal. dont gives too many signals. when red histogram cross trigger line that is up signal.and price probably will down when blue histogram cross trigger line that is dow
Dessine automatiquement les niveaux de support et de résistance PLUS les écarts des bougies de propulsion sur votre graphique, afin que vous puissiez voir où le prix est susceptible de se diriger ensuite et/ou de s'inverser potentiellement. Cet indicateur est conçu pour être utilisé dans le cadre de la méthodologie de trading de position enseignée sur mon site web (The Market Structure Trader) et affiche des informations clés pour le ciblage et les entrées potentielles. L'indicateur comport
How to use Pair Trading Station Pair Trading Station is recommended for H1 time frame and you can use it for any currency pairs. To generate buy and sell signal, follow few steps below to apply Pair Trading Station to your MetaTrader terminal. When you load Pair Trading Station on your chart, Pair Trading station will assess available historical data in your MetaTrader platforms for each currency pair. On your chart, the amount of historical data available will be displayed for each currency pai
Plus de l'auteur
Cet indicateur montre la force relative de huit principales devises (USD, EUR, GBP, AUD, NZD, CAD, CHF, JPY). Les valeurs de force sont normalisées dans la plage de 0 à 100. Une valeur supérieure à 60 signifie fort. Un nombre inférieur à 40 indique une faiblesse. Vous pouvez essayer notre guide gratuit (Pair Power Index) avant d’acheter. Le conseiller propose une valorisation de 28 paires, un trading manuel, un trading en réseau automatisé, une gestion des ordres avec trailing stop et une protec
L'indicateur comprend deux parties. Partie I : Les bougies colorées montrent la grande tendance Les bougies de couleur consistent à identifier l'état du marché à l'aide de chandeliers de couleur. Comme le montrent les captures d'écran, si la couleur est Aqua, le marché est dans un état dans lequel vous devez passer des ordres longs ou quitter des ordres courts. Si la couleur est Tomate, c'est le moment de passer des commandes courtes ou de sortir des commandes longues. Si la couleur change, il v
montre. Ce conseil concerne uniquement la couverture de compte. Version MetaTrader 4       Quick Panel Pro caractéristiques Les calculs par lots sont rapides et faciles. Lorsque vous déplacez la ligne d'arrêt, les calculs s'effectuent immédiatement. La plupart des transactions commerciales peuvent être effectuées rapidement en cliquant simplement sur ce panneau. Vous pouvez rapidement basculer entre les panneaux en cliquant simplement sur les boutons verts. EA peut être exécuté dans Strateg
OrderManager Pro
Ziheng Zhuang
4.25 (8)
This Expert Advisor is designed to manage orders. It offers the following functions: Set a stop loss for an order having none. Set a take profit for an order having none. Close the last order if the total orders of a symbol are over the setting. Close the order if its lots are over the setting. Close the order if its profit in pips is over the setting. Close the order if its loss in pips is over the setting. Close the order if its profit in amount is over the setting. Close the order if its loss
FREE
Slippage Monitor
Ziheng Zhuang
5 (2)
This EA is designed to monitor the slippage of opening and closing orders, and save the records in files. It is useful to record the slippage and evaluate brokers. The record files are saved in the folder  MT4_Data_Folder\MQL4\Files.  Go to "File " --> "Open Data Folder" . Warning : Do NOT open the files directly, otherwise it will affect the exectution of EA, just copy them to another folder and open them. Usage: Open a chart and load the EA on it, just need only one EA to run, it monitors a
FREE
Account Summary MT5
Ziheng Zhuang
4.67 (3)
This is a MetaTrader 5 script. It helps to summarize all trades into every symbol. Input Select Period: This is 7-option input. It includes Last Month, This Month, Last Week, This Week, Today, All History, and Date Specified. Specify Starting Date: Enter a date if you selected Date Specified in "Select Period" input. Specify Ending Date: Enter a date if you selected Date Specified in "Select Period" input. The summary is saved into a file in MQL5\Files folder. MT4 Version:   https://www.mql5.c
FREE
Slippage Monitor MT5
Ziheng Zhuang
4.8 (5)
This EA is designed to monitor the slippage of opening and closing orders, and save the records in csv file. It is useful to record the slippage and evaluate brokers. The record files are saved in the folder  MT5_Data_Folder\MQL5\Files.  Go to   "File " --> "Open Data Folder"   . Warning :   Do NOT open the files directly, otherwise it will affect the exectution of EA, just copy them to another folder and open them. Usage: Open a chart and load the EA on it, just need only one EA to run, it m
FREE
Cette EA a les caractéristiques : Il fournit une puissance de paire triée de       les 28 paires majeures   ,           Facilite le trading pour choisir les paires les plus fortes ou les plus faibles. La puissance de la paire est calculée avec l'indicateur       Force relative de la devise   qui est construite dans EA, les entrées par défaut sont D1,90,0 Il peut échanger n’importe quel symbole ou paire, sans se limiter aux 28 principales paires de devises. Il comprend 6 balises :       PPI, comm
FREE
Account Summary
Ziheng Zhuang
5 (1)
This is a MetaTrader 4 script. It helps to summarize all trades into every symbol. Input Select Period: This is 7-option input. It includes Last Month, This Month, Last Week, This Week, Today, All History, and Date Specified. Specify Starting Date: Enter a date if you selected Date Specified in "Select Period" input. Specify Ending Date: Enter a date if you selected Date Specified in "Select Period" input. The summary is saved into a file in MQL4\Files folder. Also, there is pop-up window for
FREE
Account Export
Ziheng Zhuang
5 (2)
This is a MetaTrader 4 script. It helps to export all trades into a CSV file as per Symbol and selected periods. Input Select Symbol: This is 2-option input. Select current symbol or all symbols to export its orders. Select Period: This is 7-option input. It includes Last Month, This Month, Last Week, This Week, Today, All History, and Date Specified. Specify Starting Date: Enter a date if you selected Date Specified in "Select Period" input. Specify Ending Date: Enter a date if you selected D
FREE
Ce conseiller offre les fonctionnalités suivantes : Position ouverte : ouvrez un ordre long ou court lorsque le prix franchit la ligne de tendance. Liquidation : Liquidez les positions longues ou courtes lorsque le prix franchit la ligne de tendance. Trailing Stop Loss – L'EA suit la ligne de tendance et continue d'augmenter le stop loss pour les ordres à long terme ou de réduire le stop loss pour les ordres à court terme. La ligne peut être une ligne de tendance ou une ligne horizontale.      
The indicator includes two parts. Part I: Color Candles Show the Major Trend Color candles is to identify the market state by color candlesticks. As shown in the screenshots, if the color is Aqua, the market is in a state when you should place long orders or exit short orders. If the color is Tomato, it is the time to place short orders or exit long orders. If the color is changing, it is better to wait for its completion (until the current bar is closed). Part II: Draw bands The inner bands is
Ce panel est composé de conseillers experts et propose six groupes de panels de trading. Version MT5 :   cache panneau rapide caractéristiques La plupart des opérations de trading peuvent être effectuées rapidement en cliquant sur les boutons de ce panneau. Changer de panneau est aussi simple que de cliquer sur le bouton vert. EA peut être exécuté sur les graphiques visuels de Strategy Tester et fournit un moyen simple de s'entraîner au trading sur la base de données historiques. Affichez le p
Quick Panel Pro
Ziheng Zhuang
5 (1)
Cet EA est un outil de trading professionnel qui intègre une gestion flexible des risques et 6 ensembles de panneaux de trading. Version MT5 :  Quick Panel Pro Hedging caractéristiques Les calculs par lots sont rapides et faciles. Lorsque vous déplacez la ligne d'arrêt, les calculs s'effectuent immédiatement. La plupart des transactions commerciales peuvent être effectuées rapidement en cliquant simplement sur ce panneau. Vous pouvez rapidement basculer entre les panneaux en cliquant simplement
This indicator shows main trend, entry zone and exit zone. This is a muti-timeframe indicator, so it is always repainting in the current period of the higher timeframe. Features Colorful Histogram: it indicates the main trend, the tomato means the market is bearish,and the sky blue means the market is bullish. Inner Blue Bands: it is entry zone for entry market, the market is relatively safe for entry. Outer Yellow Bands: it is exit zone for exit market, the market is oversold or overbought.
This indicator shows the relative strength of 8 major currencies: USD, EUR, GBP, AUD, NZD, CAD, CHF and JPY. The strength value is normalized to the range 0-100: The value above 60 means strong. The value below 40 means weak. Note: This indicator does not show strength lines, it just shows the digital result on chart. Another version with strength lines: Currency Relative Strength Inputs BarsToCalculate - Number of bars to calculate strength. MaPeriodsToSmoothLines - Moving Average periods f
Ce conseiller est un tableau de bord qui vous permet de trader plusieurs paires en un seul clic. Cliquez sur       ouvrir       Ce bouton ouvre une commande pour la paire sélectionnée. Cliquez sur       fermer       Ce bouton ferme la commande pour la paire sélectionnée. Le lot de commande est le numéro saisi par l'utilisateur. Les nombres positifs correspondent aux ordres d’achat, tandis que les nombres négatifs correspondent aux ordres de vente. Cliquez sur   le bouton Fermer   pour fermer la
This indcator shows the trend with the color histogram. It is simple and easy to use. Usage: If the histogram changes from the aqua to the fuchsia, which means the trend is up. If the histogram changes from the fuchsia to the aqua,which means the trend is down. Inputs: MaPeriods: the periods of moving average. f1: the multiplier of inner bands f2: the multiplier of outer bands Popup Window Alert Email Alert Mobile Push Alert Alerts When the trend changes from the long trend to the short trend or
Pair Power Matrix
Ziheng Zhuang
3.67 (3)
This indicator is designed to show the pair power of the major 28 paris with RSI,Stochostic,and CCI. The power value is sorted from the weak to the strong. The weaker pairs: the pairs occurs at least 2 times in the top 3 rows The stronger pairs:   the pairs occurs at least 2 times in the bottom 3 rows Users can add another symbol, so it can calculate 28+1 symbols. My advice: https://www.mql5.com/en/blogs/post/729880 A free EA with Pair Power Matrix  ---  https://www.mql5.com/en/blogs/post/732
The purpose of the inidcator is to identify the reversal point. The blue arrow is buy signal and the yellow star is its stop loss. The red arrow is sell signal and the yellow star is its stop loss. Alert feature: if there is a signal, the indicator will send alerts of  popup window,email or mobile push. Inputs: Popup Window Alert: it is false in default Email Alert : it is false in default Mobile Push Alert: it is false in default. MetaTrader 5 Version: Reversal Point Please note that the singa
Note: This EA only works on Hedging account. The MetaTrader 4 version Quick Panel This Panel is an Expert Advisor, which provides six groups of trading panel. Features Most trading operations can be quickly made by clicking the button on these panels. Changing panels is quick just by clicking the green button. The EA can run on visual chart on the strategy tester, which provides an easy method to practice trading on history data. Show the average price on a yellow-background panel and draw th
Gamma Bands   This indcator shows the trend with the color histogram. It is simple and easy to use. Usage: If the histogram changes from the aqua to the fuchsia, which means the trend is up. If the histogram changes from the fuchsia to the aqua,which means the trend is down. Inputs: MaPeriods: the periods of moving average. f1: the multiplier of inner bands f2: the multiplier of outer bands   Popup Window Alert Email Alert Mobile Push Alert Alerts When the trend changes for the long trend to the
The purpose of the inidcator is to identify the reversal point. The blue arrow is buy signal and the yellow star is its stop loss. The red arrow is sell signal and the yellow star is its stop loss. Please note that the singal is against trend,it could be continual fail. Alert feature: if there is a signal, the indicator will send alerts of  popup window,email or mobile push. Inputs: Popup Window Alert: it is false in default Email Alert : it is false in default Mobile Push Alert: it is false in
Ce conseiller offre les fonctionnalités suivantes : Position ouverte : ouvrez un ordre long ou court lorsque le prix franchit la ligne de tendance. Liquidation : Liquidez les positions longues ou courtes lorsque le prix franchit la ligne de tendance. Trailing Stop Loss – L'EA suit la ligne de tendance et continue d'augmenter le stop loss pour les ordres à long terme ou de réduire le stop loss pour les ordres à court terme. La ligne peut être une ligne de tendance ou une ligne horizontale.      
Filtrer:
Aucun avis
Répondre à l'avis