Volume Levels
- Indikatoren
-
Alexander Nikolaev
 I develop Expert Advisors, program in MQL4 and MQL5. I've been programming for a long time, I know C ++ and other languages.
Recommended advisors: - Version: 1.2
- Aktualisiert: 23 November 2021
- Aktivierungen: 15
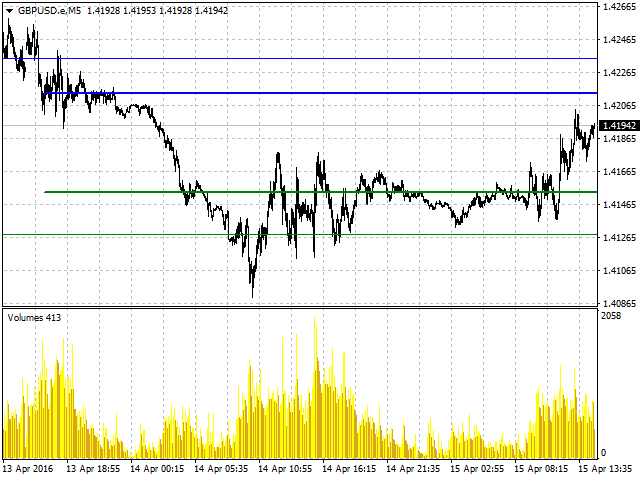
Das Volumenniveau ist ein sehr wichtiger Indikator für den Börsenhandel. Die meisten Geschäfte wurden auf diesen Niveaus getätigt. Dieser Indikator zeigt das Kursniveau an, auf dem in einem bestimmten Zeitraum das meiste Handelsvolumen erzielt wurde. Oft prallt der Kurs in der Zukunft von diesen Niveaus ab, und er kann beim Handel erfolgreich eingesetzt werden. Er funktioniert für jedes Währungspaar.
Parameter
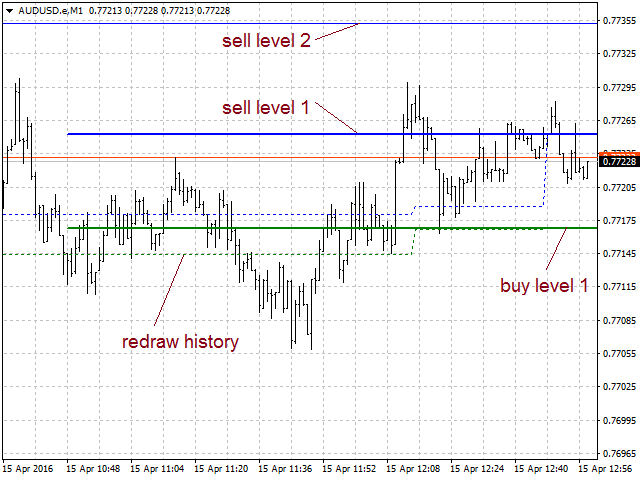
- HistoryBars - die Anzahl der Balken zur Bestimmung der nahen Volumenniveaus;
- Range - der maximale Abstand über und unter dem aktuellen Preis, um die Niveaus zu bestimmen;
- HistoryBarsLevels2 - die Anzahl der Balken zur Bestimmung der entfernten Volumenniveaus;
- MinDistanceLevels2 - der Mindestabstand zwischen dem nahen und dem entfernten Niveau;
- RedrawTime - die Zeit, in der die Pegel neu gezeichnet werden;
- Step - der Schritt zur Bestimmung der Stufen (je kleiner der Schritt, desto höher die Genauigkeit, aber die Berechnung der Stufen kann länger dauern);
- ColorLow - Farbe der unteren Ebenen;
- ColorHigh - Farbe der oberen Ebenen.
Empfehlungen
Je kleiner der Zeitrahmen und gleichzeitig je größer der Parameter HistoryBars ist, desto stärker sind die Levels. Bei der Verwendung auf einem 5-stelligen Konto ist es besser, die Parameter Range und MinDistanceLevels2 um das 5-10-fache zu erhöhen. Der Indikator eignet sich am besten für die kleineren Zeitrahmen (М1, M5, M15, M30), kann aber auch für die höheren Zeitrahmen verwendet werden.


Great product after months of using its worth to buy for sure !!