RSI All TF
- Indikatoren
- Version: 23.31
- Aktualisiert: 3 März 2023
- Aktivierungen: 20

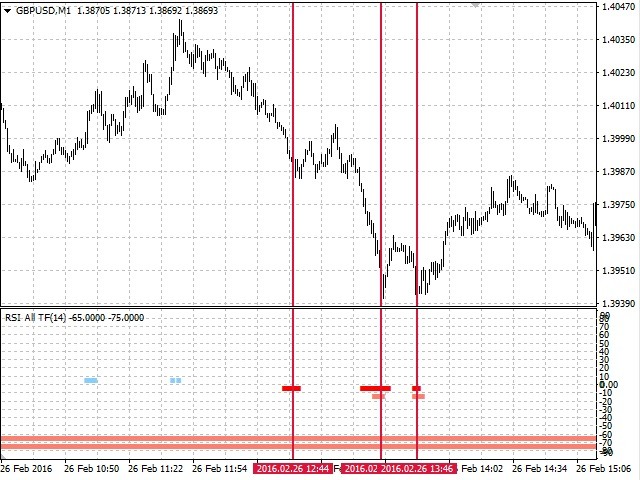
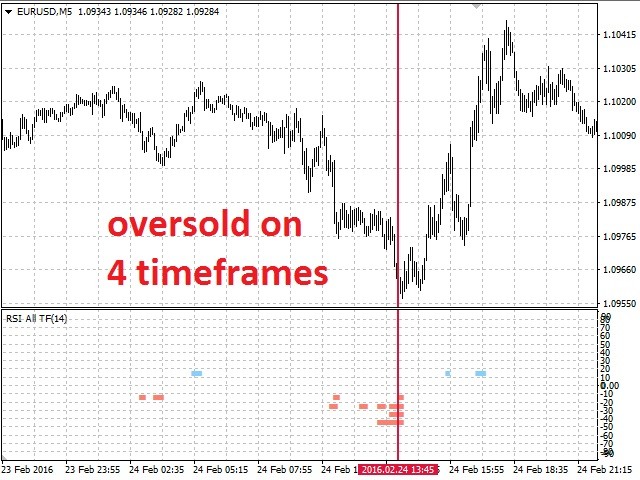
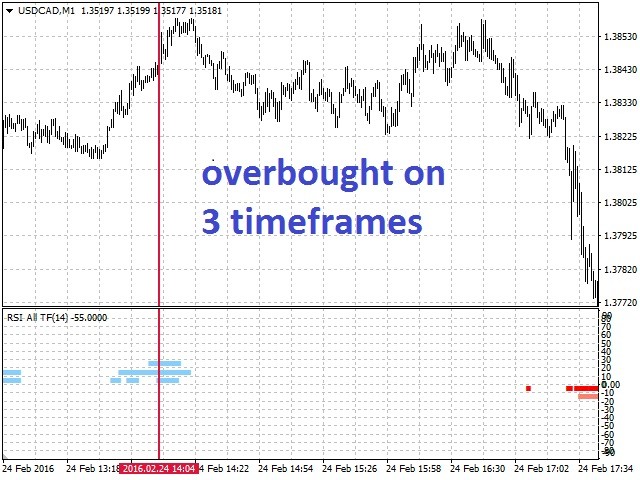
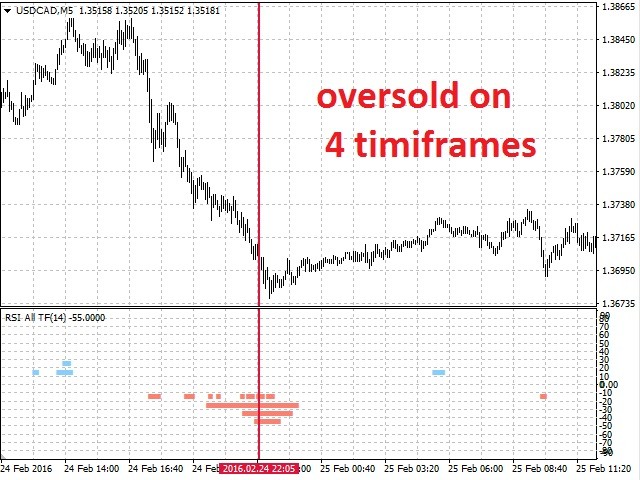
Der Indikator zeigt Einstiegssignale an, die auf der Lage des RSI in den überkauften/überverkauften Zonen auf allen Zeitrahmen basieren, beginnend mit dem aktuellen bis hin zum höchsten (MN). Wenn der RSI kleiner als die Zone, aber größer als (100-Zone) ist, wird der entsprechende Indikatorwert für den Zeitrahmen ausgefüllt:
- M1 - von 0 bis 10 (Verkauf) oder von 0 bis -10 (Kauf);
- M5 - von 10 bis 20 (verkaufen) oder von -10 bis -20 (kaufen);
- M15 - von 20 bis 30 (verkaufen) oder von -20 bis -30 (kaufen);
- M30 - von 30 bis 40 (verkaufen) oder von -30 bis -40 (kaufen);
- H1 - von 40 bis 50 (verkaufen) oder von -40 bis -50 (kaufen);
- H4 - von 50 bis 60 (verkaufen) oder von -50 bis -60 (kaufen);
- D1 - von 60 bis 70 (verkaufen) oder von -60 bis -70 (kaufen);
- W1 - von 70 bis 80 (Verkauf) oder von -70 bis -80 (Kauf);
- MN - von 80 bis 90 (Verkauf) oder von -80 bis -90 (Kauf).
Parameter
- RSI-Periode - Periode des RSI-Indikators (Standardwert ist 14).
- Zone - Größe des überkauften/überverkauften Bereichs (Standardwert ist 30).

You cannot go wrong with the price. For me, it is difficult to understand how exactly this indicator works. It does work, but I don't see the number of bars on my charts that show on this sales page. Regardless, his indicators are usually very good and very affordable. Not sure why everyone wants to pay all they have for flashy items that don't work. Mr. Surkov does a good job.