Prise Reversal mt5
- Indikatoren
- Version: 21.111
- Aktualisiert: 20 November 2021
- Aktivierungen: 20

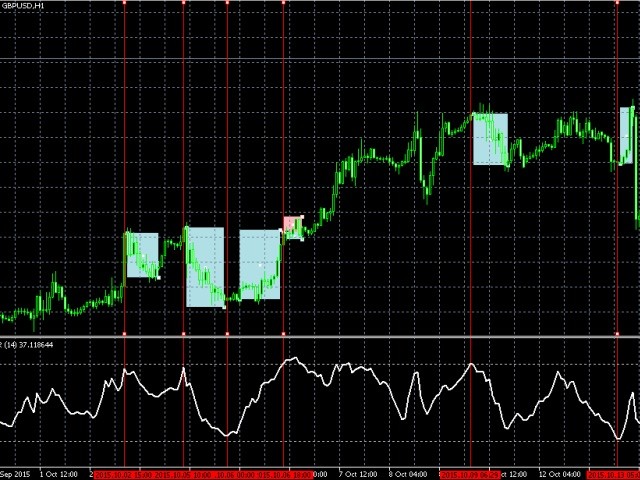
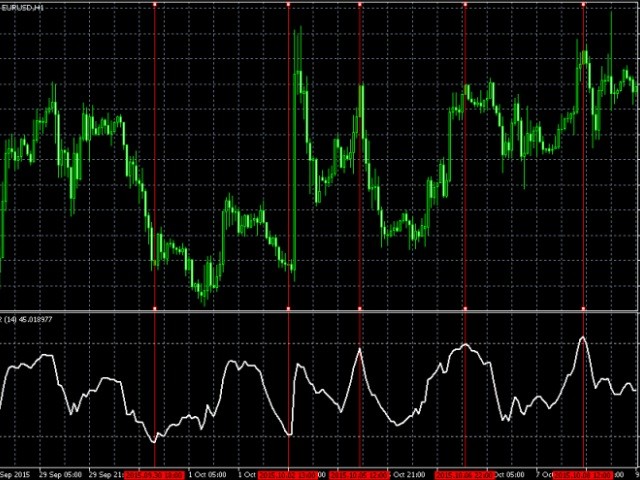
Der Oszillator verwendet Daten von Standardindikatoren und einige Muster der Preisbewegung. Anhand dieser Daten bildet er seine eigenen (genaueren) Signale für eine Änderung der Richtung der Preisbewegung. Prise Reversal hilft bei der Identifizierung von Umkehrpunkten während eines Flats und von Preisextremen während eines Trends. An diesen Punkten können Sie mit einer kurzen Gewinnmitnahme in den Gegentrend einsteigen. Außerdem zeigt er Zeitintervalle an, in denen es zu spät ist, ein trendfolgendes Geschäft zu eröffnen. Nach einigen Tagen der Anwendung des Indikators wird er zu einem festen Bestandteil Ihres Handelssystems.
Indikator-Eingabeparameter:
- Periode - Periode des Indikators. Standard-14.
Um korrekte Einstiegspunkte zu erhalten , empfehlen wir Folgendes:
- Passen Sie die Parameter für jedes gehandelte Paar und jeden Zeitrahmen an;
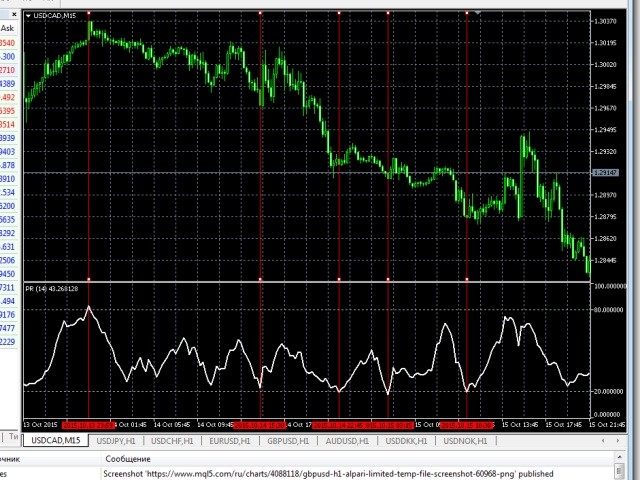
- Erhalten Sie zuerst ein Signal auf einem höheren Zeitrahmen (z.B. H1), dann warten Sie auf ein ähnliches Signal auf einem niedrigeren Zeitrahmen (z.B. M15).
- Verwenden Sie die Werte des Indikators nur mehr 77-80 und weniger 23-20.