YK Smart EMA
- Indikatoren
- Version: 1.0

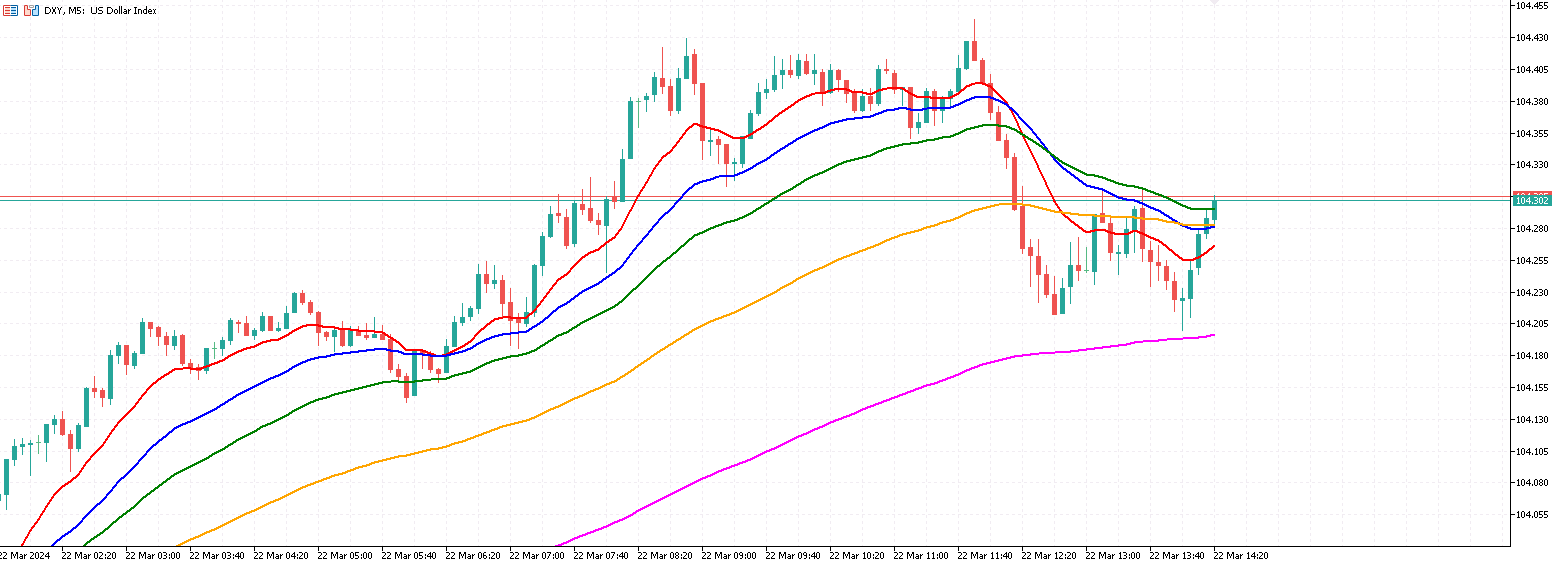
Der YK-SMART-EMA ist ein Indikator, der mehrere Exponential Moving Average (EMA)-Linien auf einem Preisdiagramm anzeigt, um die Analyse von Preistrends zu unterstützen. Dieser Indikator verfügt über fünf EMA-Linien:
- EMA14 (rote Linie): Wird auf der Grundlage der Schlusskurse der letzten 14 Kerzen berechnet.
- EMA30 (blaue Linie): Berechnet auf der Grundlage der Schlusskurse der letzten 30 Kerzen.
- EMA50 (grüne Linie): Berechnet auf der Grundlage der Schlusskurse der letzten 50 Kerzen.
- EMA100 (orangefarbene Linie): Berechnet auf der Grundlage der Schlusskurse der letzten 100 Kerzen.
- EMA200 (violette Linie): Berechnet auf der Grundlage der Schlusskurse der letzten 200 Kerzen.
Mit diesen EMA-Linien können Händler kurz-, mittel- und langfristige Preistrends analysieren. Wenn der Kurs über einer EMA-Linie liegt, deutet dies auf einen Aufwärtstrend hin, während ein Kurs unter einer EMA-Linie auf einen Abwärtstrend hindeutet. Überkreuzungen zwischen EMA-Linien verschiedener Zeiträume können einen Trendwechsel anzeigen.
Eines der besonderen Merkmale des YK-SMART-EMA sind seine Anpassungsmöglichkeiten. Der Benutzer kann jede EMA-Linie nach seinen Vorlieben ein- oder ausblenden. Außerdem können die Farben der EMA-Linien durch Anpassung der Eingabeparameter des Indikators angepasst werden.
Dieser Indikator eignet sich für Händler, die ein einfach zu bedienendes und anpassbares Werkzeug für die technische Analyse suchen. Durch die Kombination mehrerer EMA-Linien mit unterschiedlichen Zeiträumen können Händler Markttrends besser einschätzen und fundiertere Handelsentscheidungen treffen.
Der YK-SMART-EMA wurde so konzipiert, dass er benutzerfreundlich ist und sich an verschiedene Handelsstile anpassen lässt. Unabhängig davon, ob Sie ein kurzfristiger Händler oder ein langfristiger Investor sind, kann Ihnen dieser Indikator dabei helfen, potenzielle Einstiegs- und Ausstiegspunkte auf der Grundlage der Interaktion des Preises mit den EMA-Linien zu identifizieren.
Um den YK-SMART-EMA effektiv zu nutzen, sollten Händler ihn mit anderen technischen Analyseinstrumenten kombinieren und fundamentale Faktoren berücksichtigen, die den Markt beeinflussen können. Wie bei jedem Handelsinstrument ist es wichtig, ein angemessenes Risikomanagement zu betreiben und die Einstellungen des Indikators an die eigene Handelsstrategie anzupassen.
Zusammenfassend lässt sich sagen, dass der YK-SMART-EMA ein vielseitiger und anpassbarer Indikator ist, der Händlern bei der Analyse von Preistrends mithilfe mehrerer Linien des Exponential Moving Average hilft. Durch die klare visuelle Darstellung kurz- bis langfristiger Trends ist dieser Indikator eine wertvolle Ergänzung für die Toolbox jedes Händlers.