RelativeVolatilityPro
- Indikatoren
- Version: 1.0
- Aktivierungen: 5

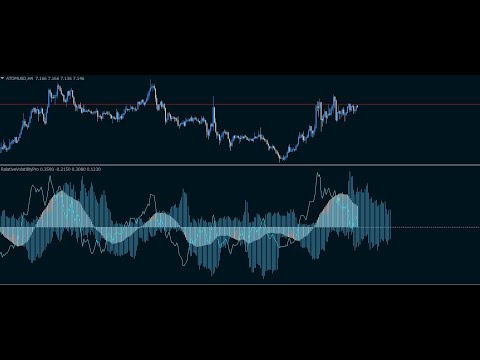
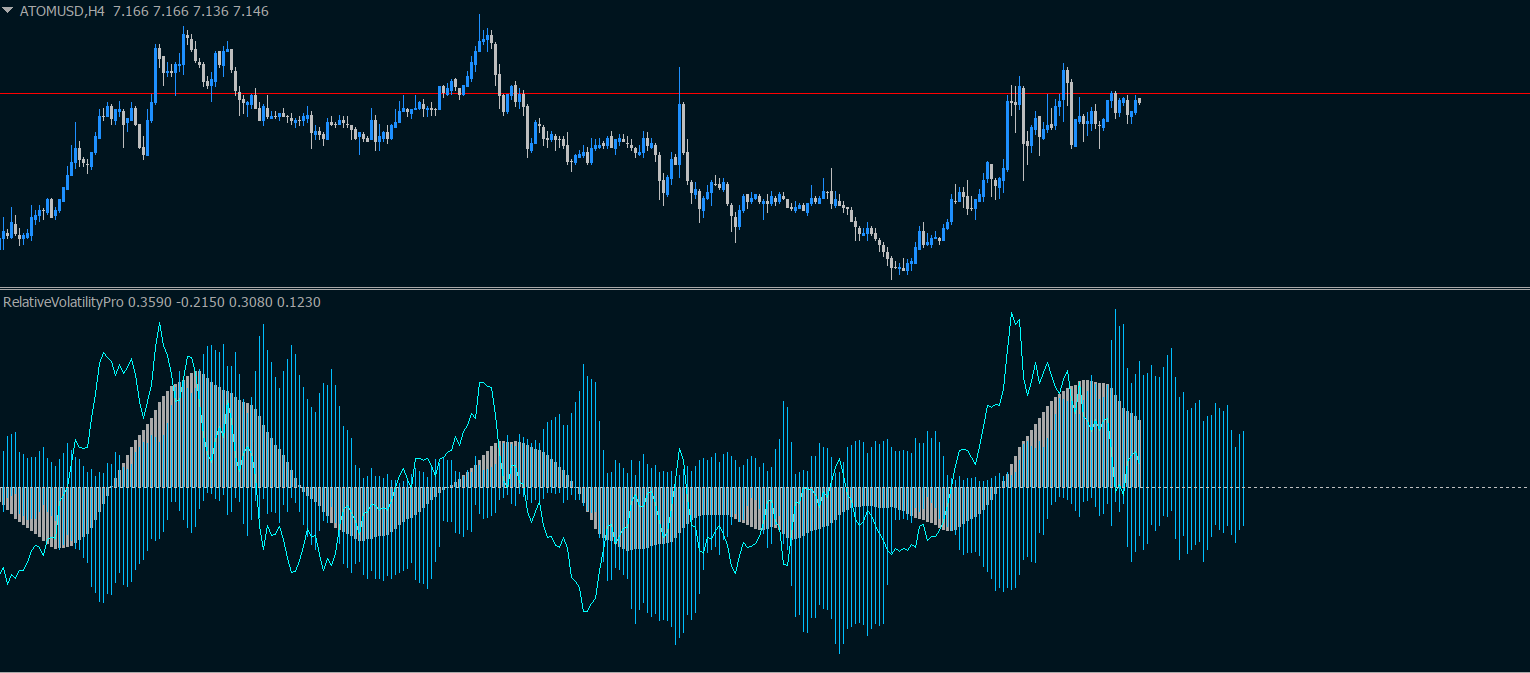
Der Indikator zeigt die Abweichung des gleitenden Durchschnitts im Verhältnis zur Volatilität in der vorderen Hälfte seiner Periode an.
Das rote Histogramm zeigt den gleitenden Durchschnitt im Verhältnis zum Ankerpunkt an.
Das blaue Histogramm zeigt die Volatilität im Verhältnis zur vorderen Hälfte
des gleitenden Durchschnitts an.
Die blaue Linie simuliert den Preis im Verhältnis zum gleitenden Durchschnitt.
Der Indikator eignet sich sowohl für das Grid-Trading als auch für das Trend-Trading.
Das Signal ändert sich nicht, wenn der Zeitrahmen wechselt