und werden Sie Mitglied unserer Fangruppe
Veröffentliche einen Link auf das Skript, damit die anderen ihn auch nutzen können
Bewerten Sie es im Terminal MetaTrader 5
- Ansichten:
- 29342
- Rating:
- Veröffentlicht:
- Aktualisiert:
-
 Sie verpassen Handelsmöglichkeiten:
- Freie Handelsapplikationen
- Über 8.000 Signale zum Kopieren
- Wirtschaftsnachrichten für die Lage an den Finanzmärkte
Registrierung EinloggenSie stimmen der Website-Richtlinie und den Nutzungsbedingungen zu.
Wenn Sie kein Benutzerkonto haben, registrieren Sie sich -
 Benötigen Sie einen Roboter oder Indikator, der auf diesem Code basiert? Bestellen Sie ihn im Freelance-Bereich
Zum Freelance
Benötigen Sie einen Roboter oder Indikator, der auf diesem Code basiert? Bestellen Sie ihn im Freelance-Bereich
Zum Freelance
Description
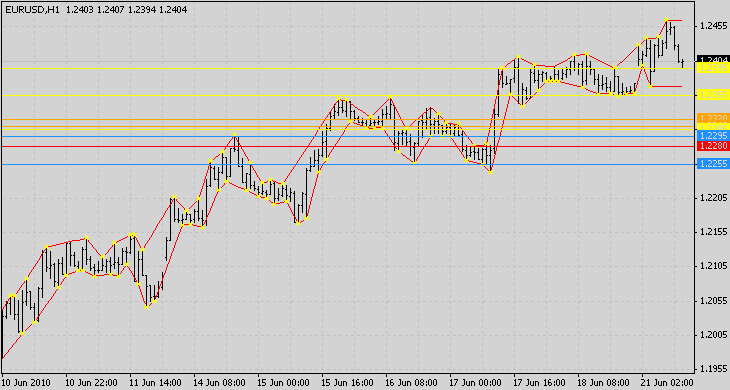
The indicator seeks for local highs and local lows. A local high/low is defined by three candles, if the high of the middle candle is higher than its neigbours it is forming a local high, if the low is lower than the neigbours it forms a local low.
![]()
We can do a break out trade if the price exceeds a local high or low and we can see a trend if the lows are rising or the highs are falling.
Each local high/low is also a resistance or support, the more the point has been hit in the past, the stronger it works as resistance or support. The indicator counts how many times a price has been hit and displays the count in a color code from white to red.
Parameters:
The parameters are used to reduce the number of horizontal lines displayed.
- PipRange: Use the same counter if the price is within a range of x Pips. For example if PipRange is 10, the prices EURUSD 1.2000 and 1.2010 use the same counter. If the PipRange is one there may be 10 lines between.
- Porcent: Display the upper x% of the range. For example if the maximum hit count of a point is 10, a value of 70 displays the upper 30 por cent of hits, only points which have been hit at least 7 times will be displayed with a horizontal line.
The horizontal lines have the colors White,Yellow,DodgerBlue,Orange,Red where White is the wakest and red the strongest. The commont for a line displays how many relative highs or lows are hitting them.
Conclusion:
Depending on the time frame of a trade and depending on the chart data we must find good parameters to display resistance zones, it varies from no line at all and lines at each price level.
Horizontal lines are built from all candles from the chart, not only from the visible ones.
We can use the resistance zones to set limit orders.
Risk warning
Use at your own risk or with demo money.
This indicator does not work as firmware for any cristal ball.
 Good EA but needs FridayClose to perform better
I got this EA from a friend. It is based on the previous day's open and close price, but I would want it to close all trade on friday at a certain time.
 Trending or Ranging and Trend Strength Indicator
The indicator shows the power of the trend that is in place and whether a pair is trending or ranging. Many user adjustable variables.
DollarIndex
A volume-adjusted reading of the net flow of USD as measured by all 7 major currency pairs.
Para_B
Parabolic SAR on the M1 from all Time Frames