und werden Sie Mitglied unserer Fangruppe
Veröffentliche einen Link auf das Skript, damit die anderen ihn auch nutzen können
Bewerten Sie es im Terminal MetaTrader 5
- Ansichten:
- 39879
- Rating:
- Veröffentlicht:
- Aktualisiert:
-
Benötigen Sie einen Roboter oder Indikator, der auf diesem Code basiert? Bestellen Sie ihn im Freelance-Bereich Zum Freelance
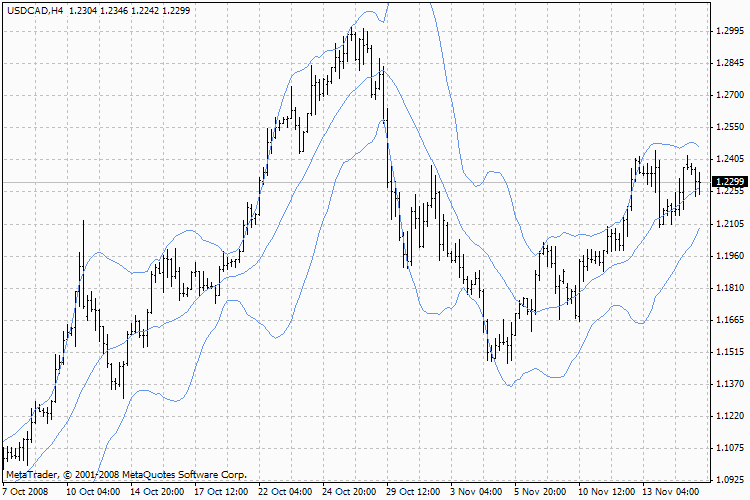
The Bollinger Bands ® (BB) are similar to the Envelopes. The only difference is that the bands of Envelopes are plotted a fixed distance (%) away from the moving average, while the Bollinger Bands are plotted a certain number of standard deviations away from it.
Standard deviation is a measure of volatility, therefore Bollinger Bands adjust themselves to the market conditions. When the markets become more volatile, the bands widen and they contract during less volatile periods.

Bollinger Bands, BB
Bollinger Bands are usually drawn on the price chart, but they can be also added to the indicator chart. Just like in case of the Envelopes, the interpretation of the Bollinger Bands is based on the fact that the prices tend to remain in between the top and the bottom line of the bands. A distinctive feature of the Bollinger Band indicator is its variable width due to the volatility of prices. In periods of considerable price changes (i.e. of high volatility) the bands widen leaving a lot of room to the prices to move in. During standstill periods, or the periods of low volatility the band contracts keeping the prices within their limits.
The following traits are particular to the Bollinger Band:
- abrupt changes in prices tend to happen after the band has contracted due to decrease of volatility;
- if prices break through the upper band, a continuation of the current trend is to be expected;
- if the pikes and hollows outside the band are followed by pikes and hollows inside the band, a reverse of trend may occur;
- the price movement that has started from one of the band’s lines usually reaches the opposite one.
The last observation is useful for forecasting price guideposts.
Calculation
Bollinger bands are formed by three lines. The middle line (ML) is a usual Moving Average.
ML = SUM (CLOSE, N) / N = SMA (CLOSE, N)
The top line (TL) is the same as the middle line a certain number of standard deviations (D).
TL = ML + (D * StdDev)
The bottom line (BL) is the middle line shifted down by the same number of standard deviations.
BL = ML — (D * StdDev)
StdDev = SQRT (SUM ((CLOSE - SMA (CLOSE, N))^2, N)/N)
where:
- SUM (..., N) — sum for N periods;
- CLOSE — close price;
- N — number of periods used in calculation;
- SMA — Simple Moving Average;
- SQRT — square root;
- StdDev — standard deviation:
It is recommended to use 20-period Simple Moving Average as the middle line, and plot top and bottom lines two standard deviations away from it. Besides, moving averages of less than 10 periods are of little effect.
Description of the technical indicator
The full description of the Bollinger Bands is available in the Technical analysis: Bollinger Bands section
Übersetzt aus dem Russischen von MetaQuotes Ltd.
Originalpublikation: https://www.mql5.com/ru/code/7818
 r_Gator
A simple alternative to the Alligator.
 Linear Regression Line
The indicator draws the linear regression line based on the closing prices of the last bars.
 Combined MA Signal
Combined MA
 ind - Profitunity Bars
The ind - Profitunity Bars indicator. Colors the bars in green, red and black.