und werden Sie Mitglied unserer Fangruppe
Veröffentliche einen Link auf das Skript, damit die anderen ihn auch nutzen können
Bewerten Sie es im Terminal MetaTrader 5

Constant Range Detector - Indikator für den MetaTrader 4

- Ansichten:
- 33003
- Rating:
- Veröffentlicht:
- Aktualisiert:
-
 Sie verpassen Handelsmöglichkeiten:
- Freie Handelsapplikationen
- Über 8.000 Signale zum Kopieren
- Wirtschaftsnachrichten für die Lage an den Finanzmärkte
Registrierung EinloggenSie stimmen der Website-Richtlinie und den Nutzungsbedingungen zu.
Wenn Sie kein Benutzerkonto haben, registrieren Sie sich -
 Benötigen Sie einen Roboter oder Indikator, der auf diesem Code basiert? Bestellen Sie ihn im Freelance-Bereich
Zum Freelance
Benötigen Sie einen Roboter oder Indikator, der auf diesem Code basiert? Bestellen Sie ihn im Freelance-Bereich
Zum Freelance
Indicator: Constant Range Size
- Detects and displays the fixed size of the Constant Range.
- Fast and easy identification of chart parameters facilitates trading efficiency.
Note: This indicator is intended for use with Constant Range (Synthetic) Bars/Candles, not Standard Bars/Candles.
- Constant Range Candles and Charts are also referred to as Range Bars (RB) and Range Bar Charts.
- Constant Range Bars/Candles all have the same fixed range value from high to low.
- Note for newbies: A Constant Range offline charts is generated from a Scripts, or Indicators, or Expert Advisor running on a M1 chart.
- Abundant additional information is available on the internet.
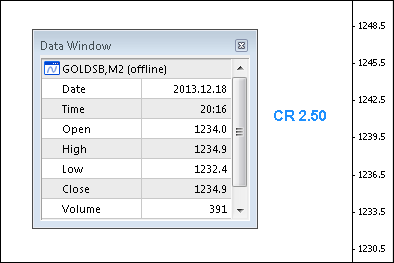
Constant Range size calculation: High - Low.
Gold. M2(offline): 1234.9 - 1232.4 = 2.5
Problem: No Ticks !
- Often the Constant Range Offline Chart is created by an EA.
- EAs rely on ticks and when markets are closed there are no ticks.
- With no ticks Constant Range Charts will not update to new Range Sizes and other inputs.
Solution: a Tick Generator - FREE - HERE . Also helps when testing in quiet - tick scarce - markets.
Parameters
- Text - CR;
- Font_Color - DodgerBlue;
- Font_Size - 11;
- Font_Bold - true;
- Left_Right - 25;
- Up_Down - 150;
- Corner - 1;
Renko Range Detector
Detects and displays the fixed size of Renko Bars/Candles on offline chart.
Value Chart Deluxe Edition
Value Chart as developed by David Stendhal. Value Chart was designed to show the valuation of the market.
 a_informer
It Is placing stop loss and take profit at a given distance. Displays the current status of open orders. For closing of the order it is enough to select and move the label to the left.
Fractal Support & Resistance Levels
The indicator draws support & resistance levels based on the last MN1, W1, D1, H4 and H1 fractals.