und werden Sie Mitglied unserer Fangruppe
Veröffentliche einen Link auf das Skript, damit die anderen ihn auch nutzen können
Bewerten Sie es im Terminal MetaTrader 5

EMAplusWPR - Experte für den MetaTrader 4

- Ansichten:
- 25635
- Rating:
- Veröffentlicht:
- Aktualisiert:
-
 Sie verpassen Handelsmöglichkeiten:
- Freie Handelsapplikationen
- Über 8.000 Signale zum Kopieren
- Wirtschaftsnachrichten für die Lage an den Finanzmärkte
Registrierung EinloggenSie stimmen der Website-Richtlinie und den Nutzungsbedingungen zu.
Wenn Sie kein Benutzerkonto haben, registrieren Sie sich -
 Benötigen Sie einen Roboter oder Indikator, der auf diesem Code basiert? Bestellen Sie ihn im Freelance-Bereich
Zum Freelance
Benötigen Sie einen Roboter oder Indikator, der auf diesem Code basiert? Bestellen Sie ihn im Freelance-Bereich
Zum Freelance
ACTUAL VERSION : http://codebase.mql4.com/en/code/10413
Expert advisor that trade in the trend of EMA and buy/sell signals get from Williams %R
I have tried to create an Expert advisor that could by traded with 1000 EUR starting equity and to minimize the drawdown. Hope you like it. I appreciate every feedback.
Inputs EMA, iWPRPeriod are optimized for EURUSD 5M
TakeProfit = 200;
maxStopLoss=50;
maxLots = 0.1; // max lots per position
maxContracts = 2; // max open positions, 2 is optimal for smoother equity
EMA=144; // EMA to determine trend
iWPRPeriod=46; // Williams' Percentage Range to determine buy/sell signals
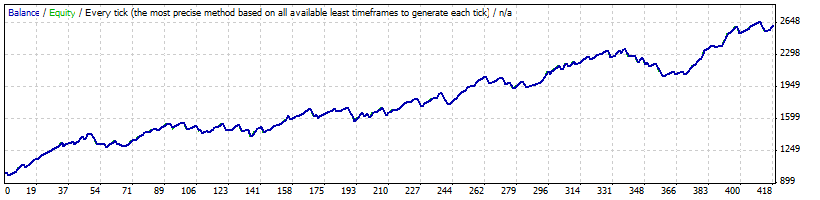
Test is without position sizing, 0.1 lot size
| Symbol | EURUSD (Euro vs US Dollar) | ||||
| Period | 5 Minutes (M5) 2010.01.04 00:00 - 2011.02.01 23:55 (2010.01.01 - 2011.02.02) | ||||
| Model | Every tick (the most precise method based on all available least timeframes) | ||||
| Parameters | TakeProfit=200; maxStopLoss=50; maxLots=0.1; maxContracts=2; EMA=144; iWPRPeriod=46; | ||||
| Bars in test | 59026 | Ticks modelled | 7365768 | Modelling quality | n/a |
| Mismatched charts errors | 8220 | ||||
| Initial deposit | 1000.00 | ||||
| Total net profit | 1624.88 | Gross profit | 4601.32 | Gross loss | -2976.44 |
| Profit factor | 1.55 | Expected payoff | 3.90 | ||
| Absolute drawdown | 27.02 | Maximal drawdown | 331.92 (13.99%) | Relative drawdown | 13.99% (331.92) |
| Total trades | 417 | Short positions (won %) | 198 (71.21%) | Long positions (won %) | 219 (75.80%) |
| Profit trades (% of total) | 307 (73.62%) | Loss trades (% of total) | 110 (26.38%) | ||
| Largest | profit trade | 45.15 | loss trade | -39.67 | |
| Average | profit trade | 14.99 | loss trade | -27.06 | |
| Maximum | consecutive wins (profit in money) | 20 (273.90) | consecutive losses (loss in money) | 5 (-118.47) | |
| Maximal | consecutive profit (count of wins) | 326.41 (15) | consecutive loss (count of losses) | -153.43 (4) | |
| verage | consecutive wins | 5 | consecutive losses | 2 | |
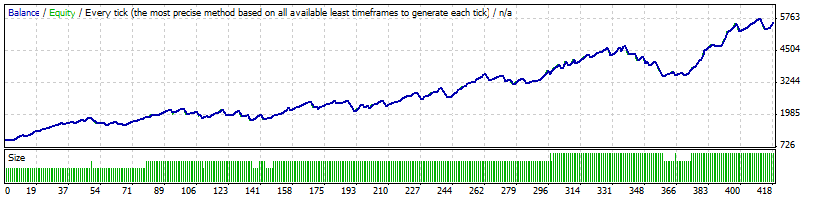
To use my position sizing increase the maxLots size
For position sizing I use the following code:
Ilo=0.1* MathSqrt((AccountBalance()) / 300);
Lots=NormalizeDouble(Ilo, 1);
if (Lots<0.1) Lots=0.1;
if (Lots>maxLots) Lots=maxLots;
Strategy Tester Report
| Symbol | EURUSD (Euro vs US Dollar) | ||||
| Period | 5 Minutes (M5) 2010.01.04 00:00 - 2011.02.01 23:55 (2010.01.01 - 2011.02.02) | ||||
| Model | Every tick (the most precise method based on all available least timeframes) | ||||
| Parameters | TakeProfit=200; maxStopLoss=50; maxLots=5; maxContracts=2; EMA=144; iWPRPeriod=46; | ||||
| Bars in test | 59026 | Ticks modelled | 7365768 | Modelling quality | n/a |
| Mismatched charts errors | 8220 | ||||
| Initial deposit | 1000.00 | ||||
| Total net profit | 4629.01 | Gross profit | 14103.33 | Gross loss | -9474.32 |
| Profit factor | 1.49 | Expected payoff | 11.10 | ||
| Absolute drawdown | 54.04 | Maximal drawdown | 1293.48 (27.32%) | Relative drawdown | 27.32% (1293.48) |
| Total trades | 417 | Short positions (won %) | 198 (71.21%) | Long positions (won %) | 219 (75.80%) |
| Profit trades (% of total) | 307 (73.62%) | Loss trades (% of total) | 110 (26.38%) | ||
| Largest | profit trade | 176.09 | loss trade | -154.73 | |
| Average | profit trade | 45.94 | loss trade | -86.13 | |
| Maximum | consecutive wins (profit in money) | 20 (547.80) | consecutive losses (loss in money) | 5 (-554.73) | |
| Maximal | consecutive profit (count of wins) | 1237.52 (15) | consecutive loss (count of losses) | -554.73 (5) | |
| Average | consecutive wins | 5 | consecutive losses | 2 | |
 Urban Towers
The indicator shows the arrows point of entry into the position according to the Urban Towers Scalping Strategy.
Market Flow Analysis Method (MFAM) Indicator for Price Action
This indicator relies on price action alone - does the price break a previous High or Low?
 "Native" MQL HTTP Client
This library implements two simple HTTP GET / POST function and does not require external dll(s).
 Twitpic - Send chart screenshot
Drop the script on your chart to send a screenshot to twitpic with or without a message