Best Wilder Trend Reaction Strategy
- 指标
- 版本: 1.0
- 激活: 10

“NEW CONCEPTS IN TECHNICAL TRADING SYSTEMS”(1978) and on pages 71-86/SECTION VII.
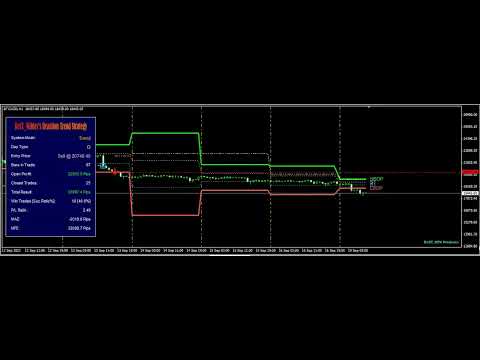
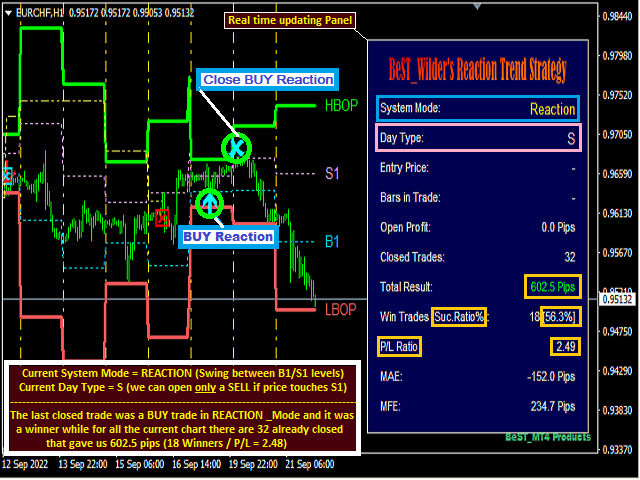
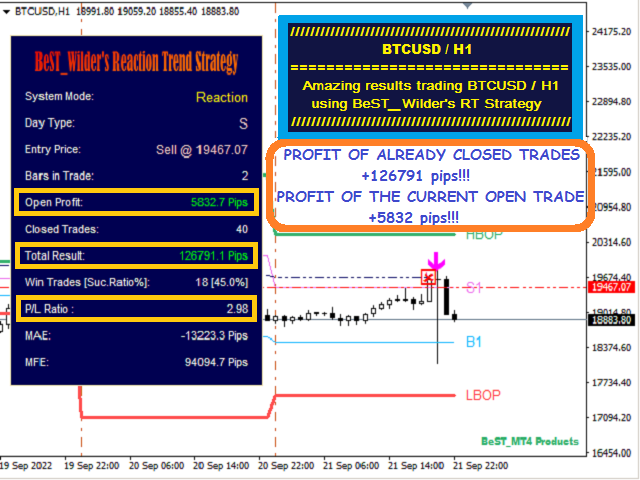
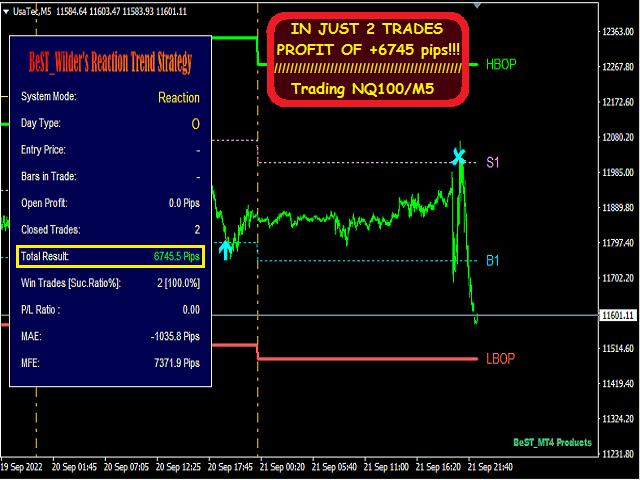
Obviously this Strategy can make money in all of the market conditions either on a non-directional/swing market or in a directional/trend market.
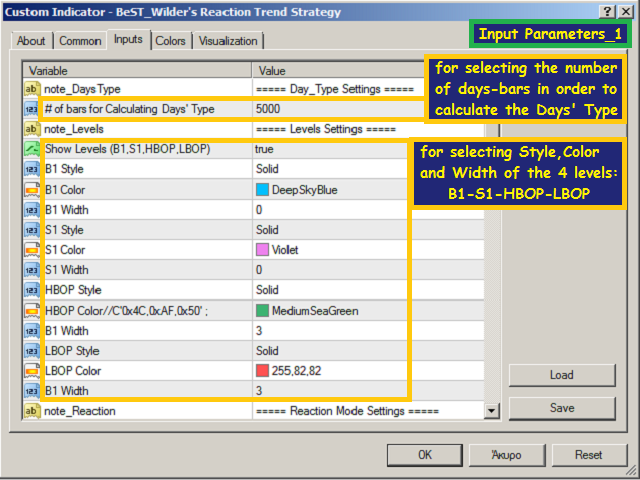
Inputs
== # of bars for Calculating Days' Type (the only value to optimize)
Levels Settings
== Show Levels (B1, S1, HBOP, LBOP) – calculated using previous day values
== B1 Style, Color, Width
== S1 Style, Color, Width
== HBOP Style, Color, Width
== LBOP Style, Color, Width
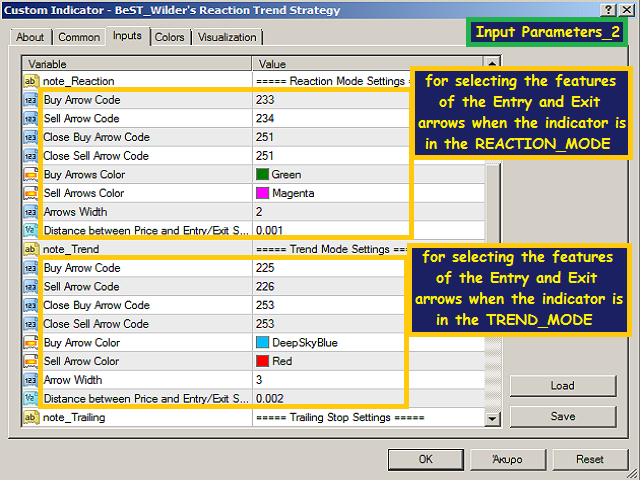
== Buy, Sell, Close Buy, Close Sell Arrows codes
== Buy, Sell Arrows colors
== Arrows Width
== Distance between Price and Entry/Exit Signs (Arrows)
== Buy, Sell, Close Buy, Close Sell Arrows codes
== Buy, Sell Arrows colors
== Arrows Width
== Distance between Price and Entry/Exit Signs (Arrows)
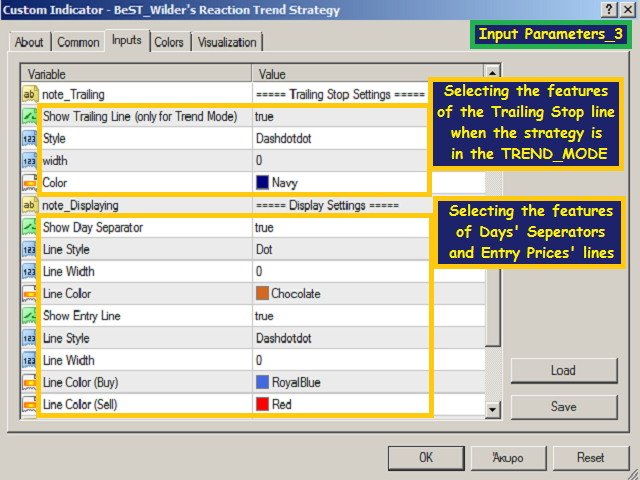
== Show Trailing Line (only for Trend Mode)
== Style, Width, Color
== Show Day Separator
== Line Style, Width, Color
== Show Entry Line
== Line Style, Width, Color (Buy/Sell)
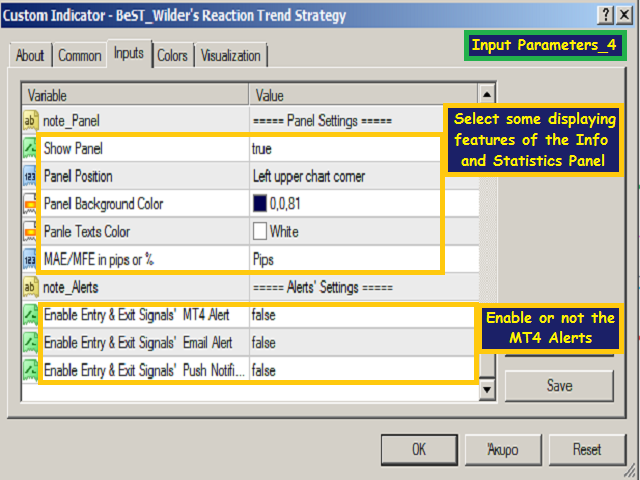
== Show Panel
== Panel Position (Corner), Background Color, Texts Color
== MAE/MFE in pips or % (select)
== Enable Entry & Exit Signals' MT4 Alert
== Enable Entry & Exit Signals' Email Alert
== Enable Entry & Exit Signals' Push Notification