Triple Supertrend Buy Sell
- 指标
- 版本: 1.1
- 激活: 5
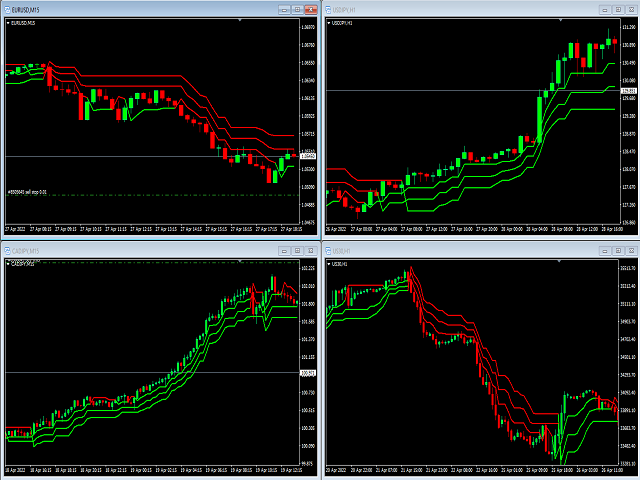
Supertrend indicator uses a combination of a moving average and average true range to detect the trend of a trading instrument.
Supertrend indicator for MetaTrader 5 easily shows the trend as a line following the price.
USAGE THIS INDICATOR
If the closing prices are above Supertrend Line, there is a Bullish sentiment at that moment. The opposite is a Bearish sentiment.
Three green lines - Strong Bullish sentiment.
Three red lines - Bearish sentiment.
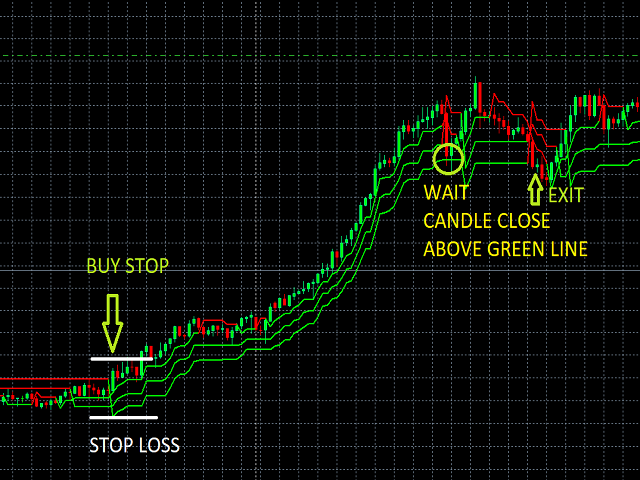
For BUY :
- Three green lines and price above EMA (200)
- Stop Loss below last supertrend red line.
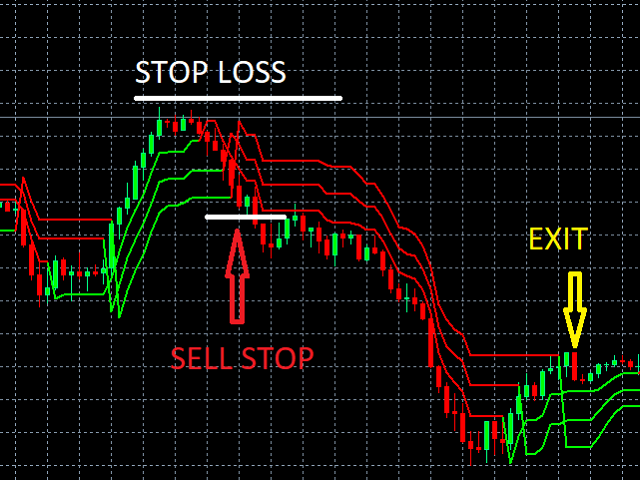
For SELL:
- Three red lines and price bellow EMA (200)
- Stop Loss above last supertrend green line.
Some traders use the Supertrend Line as a Stop Loss boundary.