Trend Direction Up Down indicator for MT4
- 指标
-
Renaud Herve Francois Candel
 ITC SOFTWARE is a technology company based in the United States since 2010.
🟠🔴 The company develops financial software and indicators for different trading platforms:
-Metatrader 4 and Metatrader 5
-TradingView
-NinjaTrader - 版本: 1.50
- 更新: 2 七月 2023
- 激活: 5
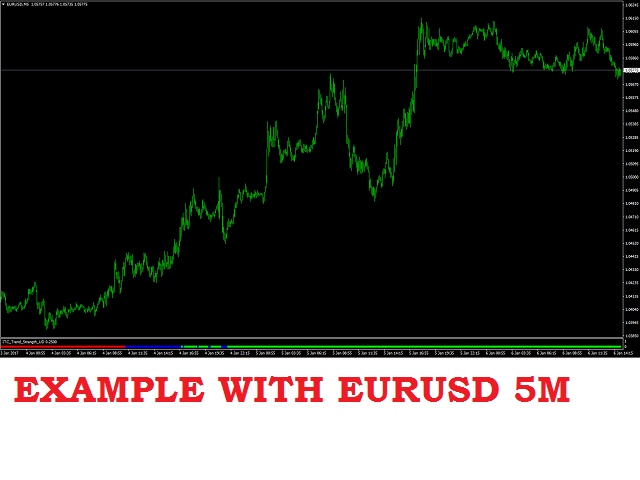
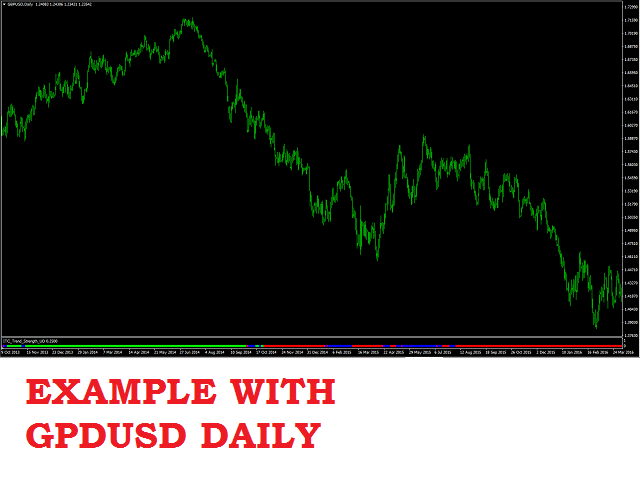
Trend Direction Up Down indicator
Trend Direction Up Down is part of a series of indicators used to characterize market conditions.Almost any strategy only works under certain market conditions.
Therefore it is important to be able to characterize market conditions at any time: trend direction, trend strength, volatility.
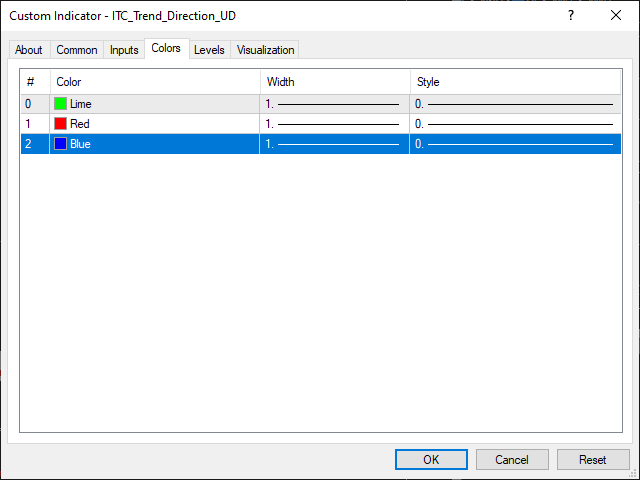
Trend Direction Up Down is an indicator to be used to characterize trend direction (medium term trend):
- trending up
- trending down
- ranging
Trend Direction Up Down displays easy to read information about trend direction.
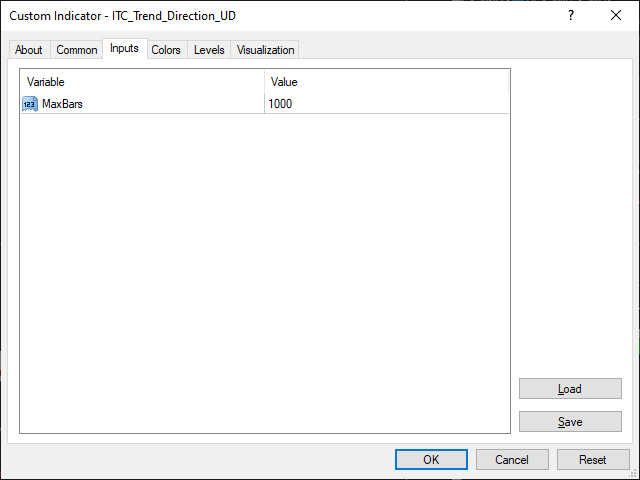
Indicator has only 1 input:
- MaxBars: number of bars to be calculated and displayed
Indicator is ready to be used directly in your chart without any optimization.
It is sometimes difficult to say if market is up or down. And it is very important to be able to filter signals and go with the trend.
Trend Direction UD gives you a clear and very effective tool to go with the trend. No more guess. No more headache.
If you are looking for an indicator to filter signals and go with the trend then Trend Direction UD indicator would suite very well.
Trend Direction UD indicator can be used with any class of assets: Forex, Stocks, Indices, Futures, Commodities and Cryptos.
Trend Direction UD can used with any time frame.
Other indicators for MT4:
We developed more than 60 indicators and utilities for Metatrader 4 and Metatrader 5.
Indicators for MT5:
All our indicators are developed both for MT4 and MT5.
List of all our indicators:
👉 You can get the complete list of our indicators visiting our profile page.