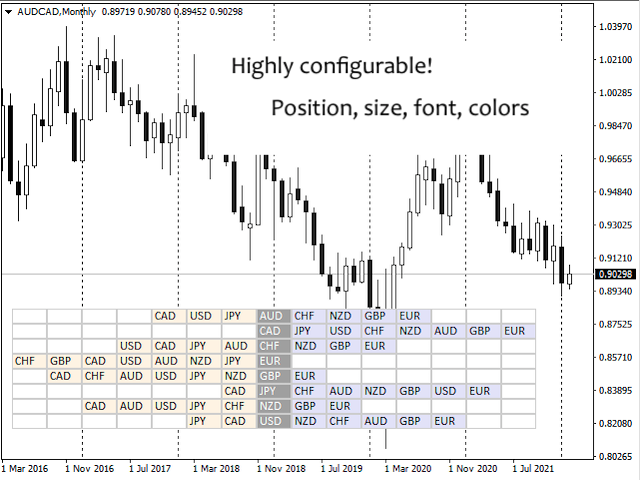
Coral Heatmap

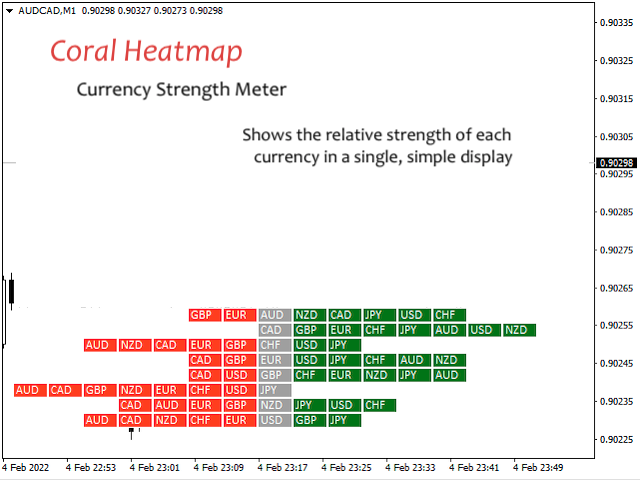
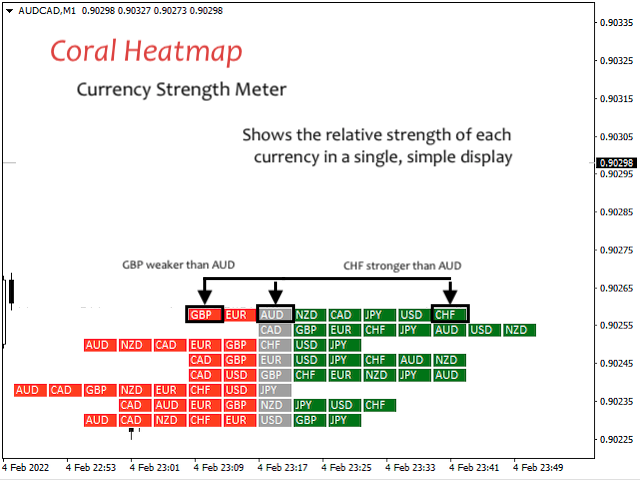
Coral Heatmap is a currency strength meter based on the ATR values for the selected timeframe.  There are two main view modes:

  • All Currencies (default) - see the ranked strength of all currencies in a single view
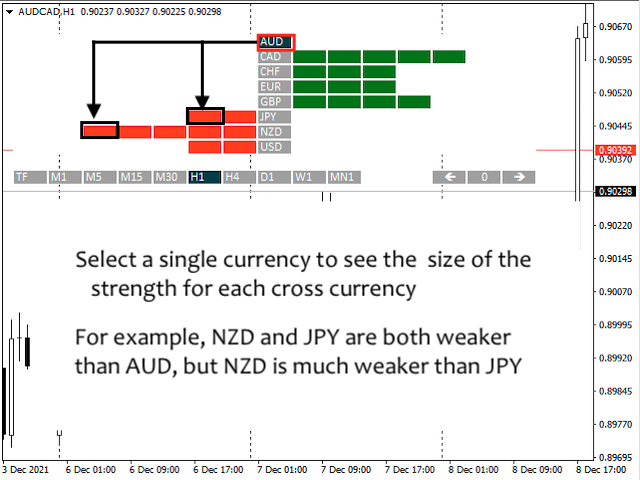
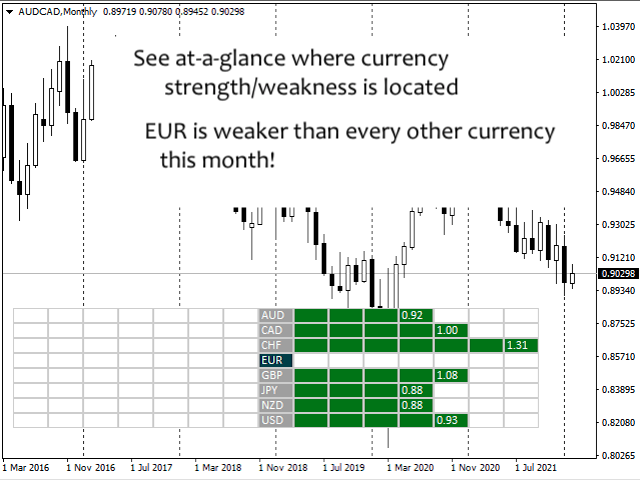
  • Selected Currency - see the relative strength of all other currencies compared to a selected currency

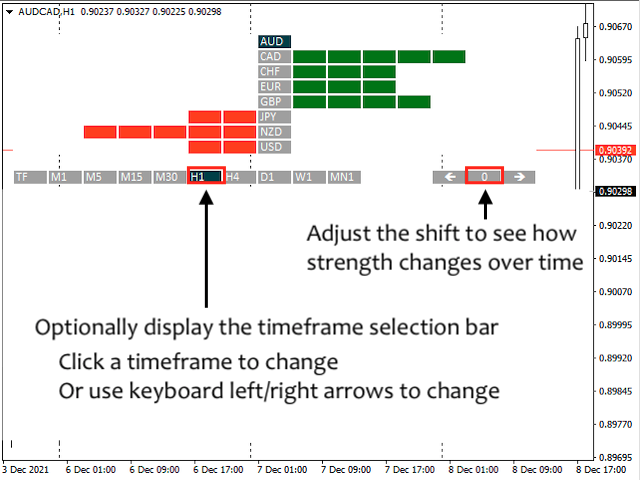
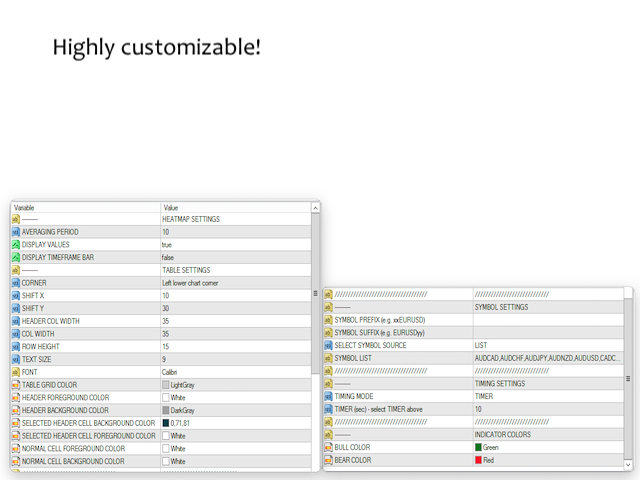
You can optionally display the timeframe selection toolbar; timeframe is always synchronized to the current chart timeframe.  Use keyboard shortcuts to quickly navigate currencies (up/down arrows) or timeframes (left/right arrows).

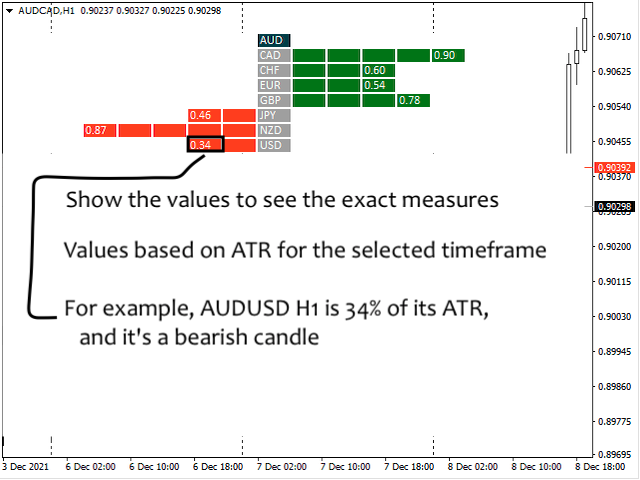
With a single currency selected, you can optionally display the % ATR values for every other currency.  Values are calculated as the % ATR for the selected timeframe, and are scaled to fit the meter's dimensions.  There is also an option to adjust the shift (the timeframe toolbar must be displayed), so you can see how relative strength changes over time.

NOTE: The indicator will not display values correctly in the strategy tester.  You can try the demo to explore configuration options, but the displayed data will not accurately reflect the data being tested.

If you like Coral Heatmap, please take a look at my other products available in the market!

推荐产品
ChangePeriod MT4
Kazuya Yamaoka
You can change the time period of the chart at the touch of a button. You can also change multiple charts at the touch of a button. You can also change multiple charts at the touch of a button, saving you the trouble of changing time periods. We are live-streaming the actual operation of the system. https://www.youtube.com/@ganesha_forex We do not guarantee your investment results. Investments should be made at your own risk. We sharll not be liable for any disadvantage or damage caused by th
Proxy OrderFlow MT4
Vincent Jose Proenca
5 (1)
Proxy Order Flow – Imbalance Tick-Spread 基于点差不平衡的指标。 TF: 适用于所有时间周期(M1 到 D1)。 交易品种: 兼容外汇、指数、黄金和差价合约(自动适配 JPY、黄金和 CFD 品种)。 参数: TickWindow (200) – 观察的 tick 窗口 SpreadWeight (1.5) – 点差权重 NormalizationPeriod (20) – 标准化周期(z-score) Overbought / Oversold (±3.0) – 超买/超卖阈值 AlertCooldown (300s) – 警报冷却时间 结论: Proxy Order Flow – Imbalance Tick-Spread v2.4 通过分析 OHLC 变化和点差,识别买卖压力,清晰显示市场流向与不平衡区域。
Multi Pivot Indicator - Professional Trading Tool MULTI PIVOT PRO INDICATOR Professional Multi Pivot Indicator for MT4 5-in-1 Pivot Indicator Professional Trading Tool for MetaTrader 4 ENGLISH TÜRKÇE Multi Pivot Indicator PRO Classic Fibonacci Camarilla Woodie DM What is Multi Pivot Indicator? Multi Pivot Indicator is a professional trading tool that displays 5 different pivot calculation methods on your MetaTrader 4 charts. Pivot points are critical support and resistance
TWO PAIRS SQUARE HEDGE METER INDICATOR Try this brilliant 2 pairs square indicator It draws a square wave of the relation between your two inputs symbols when square wave indicates -1 then it is very great opportunity to SELL pair1 and BUY Pair2 when square wave indicates +1 then it is very great opportunity to BUY pair1 and SELL Pair2 the inputs are : 2 pairs of symbols         then index value : i use 20 for M30 charts ( you can try other values : 40/50 for M15 , : 30 for M30 , : 10 for H1 ,
Matrixs
Andriy Sydoruk
Matrix is a Forex arrow indicator. Displays signals simply and clearly! The arrows show the direction of the transaction, and are colored accordingly, which can be seen in the screenshots. As you can see, trading with such an indicator is easy. I waited for an arrow to appear in the desired direction - I opened a deal. An arrow formed in the opposite direction - closed the deal. The indicator also displays the lines with the help of which the arrow signals are formed, taking into account the int
Commodity Channel Index Message is an indicator for the MetaTrader 4 trading platform. Unlike the original indicator, this three in one version has a system of alerts that inform on market situation changes. It consists of the following signals: when the Main line crosses the levels of extreme zones and 50% level; when the Main line crosses the Trend line in the indicator window; Divergence on the last bar. Values of the middle and extreme levels and divergence zones are customizable. Parameter
The Candlestick Pattern Detector is an advanced MetaTrader 4 indicator designed to identify and highlight candlestick patterns on your charts. Currently, the indicator detects one specific candlestick pattern - the pinbar, known for its significance in technical analysis and trading strategies. This tool provides traders with visual cues, making it easier to spot potential market reversals or continuations. Features: Customizable Colors: Users can customize the colors of the bullish and bearish
AdvCopyTraders
Chukwudi Joshua Obiekwe
AdvCopyTraders PRO is a powerful and ultra-fast trade copier designed for traders who manage multiple MT4 accounts. It duplicates all trades from a Master account to one or more Slave accounts instantly — including entries, exits, modifications, SL/TP updates, and partial closes. Whether you're a signal provider, fund manager, or using multiple brokers, this copier guarantees perfect synchronization and zero execution delay on the same PC/VPS. Key Features Instant Copying (0–1ms) Lightning-f
Laguerre SuperTrend Clouds adds an Adaptive Laguerre averaging algorithm and alerts to the widely popular SuperTrend indicator. As the name suggests, Laguerre SuperTrend Clouds (LSC) is a trending indicator which works best in trendy (not choppy) markets. The SuperTrend is an extremely popular indicator for intraday and daily trading, and can be used on any timeframe. Incorporating Laguerre's equation to this can facilitate more robust trend detection and smoother filters. The LSC uses the impro
Gold Strength Index Pro
Pieter Gerhardus Van Zyl
Gold Strength Index Pro (GSI Pro)  is an indicator designed to analyze gold's strength across multiple currency pairs. It aggregates weighted price data from 7 XAU pairs (e.g., XAUUSD, XAUEUR) over a user-defined lookback period, calculating a composite strength value. Key features include: Color-Coded Histogram : Displays bullish (green) and bearish (red) - momentum based on a threshold zone (±0.2 default). Smoothed Lines : A gold-colored EMA (SmoothPeriod) reduces noise, while a DodgerBlue si
Currency Spread Calculator Plus
Opengates Success International
Currency Spread Calculator Plus This indicator is created with the aim of letting the Traders know the exact points of the spread on the currency pair they are about to buy or sell. What makes it a PLUS is that Symbol/Time frame Changer is coded with this indicator to make it easier navigating from one currency pair to another and one time frame to another on the same chart window without having to open tens of chart window in order to study more currency pairs. It saves time, energy, stress a
Arrow Micro Scalper 是一款专为剥头皮和短期交易而设计的指标,可集成到任何图表和金融工具(货币、加密货币、股票、金属)中。 在她的工作中,她使用波浪分析和趋势方向过滤器。建议在从 M1 到 H4 的时间范围内使用。 如何使用指标。 该指标包含 2 个用于更改设置的外部参数,其余参数已默认配置。 大箭头表示趋势方向的变化,蓝色箭头表示下降趋势的开始,粉红色箭头表示上升趋势的开始。 “ Only trending direction ”参数启用和禁用使用内部趋势的模式,提供使用您自己的趋势或不使用趋势的机会,并且还启用/禁用仅根据趋势显示趋势箭头和信号箭头。 小信号箭头,该指标最重要的对象,粉色代表“买入”交易,蓝色代表“卖出”交易。 “ Smoothing ”参数决定信号箭头出现的时间,操作范围为 7 到 25,为时间范围 M1-M5 选择大值,为 M15-H1 选择中值,为 H4 - D1 选择小值。 趋势箭头和开始信号箭头有警报。 指标不会重新绘制。
Phase Analytics Pro: Advanced Cyclic Market Analyzer Phase Analytics Pro is a sophisticated technical tool designed for traders who prioritize mathematical precision over lag-heavy traditional indicators. Based on the principles of digital signal processing, this indicator decomposes price action into phase and quadrature components to identify the dominant market cycle. How it works: The algorithm calculates the instantaneous phase of the market, allowing it to distinguish between trending and
我们的 Basic Support and Resistance 指示器是提高技术分析所需的解决方案。该指标允许您在图表/ MT5版本 功能 斐波那契水平的集成: 可以选择显示斐波那契水平以及支持和阻力水平,我们的指标使您对市场行为和可能的逆转区域有更深入的了解。 性能优化: 只能在每个栏的打开时更新扩展线,我们的指标可确保最佳性能,而无需牺牲支持和阻力级别的准确性。 输入 主设置 Timeframe:   通过此输入,您可以选择在图表上显示较高时间范围的支撑线和阻力线。 Support/Resistance Strength [Number of Bars]:  使用此输入,您可以确定支撑和电阻的强度。数量越高,支持/阻力越强。 Price mode: 此参数允许您选择哪种价格将用于计算支持和电阻水平。它可以是收盘价,最高价格,最低价格等。取决于您的策略和偏好,您可以选择最适合您需求的价格。 显示设置 Display Fibonacci levels: 此参数确定是否将显示斐波那契水平以及图表上的支持和电阻级别。斐波那契水平是技术分析中使用的关键水平,并使用斐波那契序列进行计算
限时优惠 “限时发布价格” “2.0版本后将涨价” Currencies Gold Momentum Flow Dashboard — 即刻洞察市场强弱 一款强大的多合一交易面板,实时显示外汇与黄金在多个时间周期(M5–D1)的动量。 多时间周期ROC分析 内置交易信号(趋势一致与动量变化) 货币强弱指标 热力图快速识别趋势 实时提醒 + 一键切换交易品种 无需来回切换图表 — 一个界面掌握整个市场。 像真正看懂市场一样交易 大多数交易者是“盲目的”。 他们不断切换图表… 追逐信号… 入场太晚…离场困惑。 这一切,到此为止。 看到别人看不到的机会 这不仅仅是一个指标。 这是一个“市场透视系统”,帮助你看到: 哪些交易对正在爆发 哪些货币正在主导市场 哪些高概率机会正在形成 为精准交易者打造 提前捕捉动量变化 确认多周期趋势一致 避免震荡行情 专注高质量机会 内置优势 智能信号系统 货币强弱分析 热力图分析 实时提醒 一键执行 彻底改变你的交易方式 交易什么 何时交易 哪个方向概率最高 ️ 大多
Hunter RD
Ruben David Santana Rodriguez
Este indicador trabaja de manera multitimeframe en periodos 1D y 4H , las señales son las siguientes : las entradas al mercado se dan cuando el indicador muestra color azul claro o azul para operaciones al alza , para operaciones a la baja , debe aparecer los colores naranja o rojo. Cuando el indicador tiene los colores amarillo o blanco , se debe evitar entrar al mercado ya que no hay una tendencia clara de mercado , el stop loss se coloca en el ultimo area de swing alto\bajo el take profit deb
Manual Zone Lines Pro 是一款适用于 MT4 图表的辅助工具,可以创建手动价格区域和向右延伸的线段, 并支持多时间周期显示和提醒功能。 与 MT4 标准水平线不同,本工具创建的线段不会无限向左延伸。 线段会从创建位置开始,并向右延伸到最新K线附近, 因此可以让图表更加整洁, 也更容易看清这条线是从哪里开始绘制的。 价格区域也可以通过按钮一键创建。 创建后的区域和线段会自动延伸到最新K线附近, 因此不需要反复手动调整右端位置。 Pro 版本最多可以创建 2 个价格区域和 2 条线段。 同时支持多时间周期显示, 因此可以在一个时间周期创建区域和线段,并在其他时间周期查看, 例如在 M1 创建后,在 M5 上显示。 Manual Zone Lines Pro 还支持区域和线段的触碰提醒与突破提醒。 当价格触碰手动设置的区域或线段时, 或者当价格以K线收盘价突破它们时,可以收到提醒。 默认情况下,提醒设置为   每个对象、每种提醒类型只提醒一次 。 例如,如果某个价格区域的触碰提醒已经触发过一次, 那么同一个区域的触碰提醒将不会再次触发。 但是,触碰提醒和突破提醒会被视为不
IceFX VelocityMeter Mini is a very unique indicator on MetaTrader 4 platform which measures the speed of the Forex market . It is not a normal volume or other measurement indicator because IceFX VelocityMeter Mini is capable to understand market speed movements which are hidden in ticks and those valuable information cannot be read in an ordinary way from the candles. The software monitors the received ticks (frequency, magnitude of change) within a specified time range, analyzes these info and
This multicurrency indicator is the Lite version of the Cosmic Diviner Reversal Zone Pro indicator. The indicator is based on original formulas for analyzing the volatility and price movement strength. This allows determining the overbought and oversold states of instruments with great flexibility, as well as setting custom levels for opening buy or sell orders when the overbought or oversold values of the instruments reach a user-defined percentage. A huge advantage of Reversal Zone Lite is the
Step into the world of Forex trading with confidence, clarity, and precision using   Gold Indicator   a next-generation tool engineered to take your trading performance to the next level. Whether you’re a seasoned professional or just beginning your journey in the currency markets, Gold Indicator equips you with powerful insights and help you trade smarter, not harder. Built on the proven synergy of three advanced indicators, Gold Indicator focuses exclusively on medium and long-term trends eli
Candle finder robot MT4 Candle finder robot is one of the trading assistant tools that helps the trader, this tool helps the trader to examine all the currency pairs that are in the Metatrader watch list in detail within a few seconds. Find the desired signals. According to the strategy that is defined for this robot, in your watch list, it carefully looks for trend change candles, there are many trend change candles that traders use in their trading decisions. This robot can simply check all t
Visual River Flow Divergence Indicator MT4
AL MOOSAWI ABDULLAH JAFFER BAQER
Introducing the River Flow Divergence Indicator Are you ready to unlock your trading potential? Meet the River Flow Divergence Indicator, a powerful tool designed to help you navigate market trends and reversals with precision. This indicator is tailored for traders who are eager to fine-tune their strategies and take control of their success. Note: This indicator is not optimized out of the box. It’s crafted for you to customize and optimize according to your unique trading style and goals. Ho
这是一个预测蜡烛收盘价的指标。 该指标主要用于 D1 图表。 该指标适用于传统外汇交易和二元期权交易。 该指标可以用作独立的交易系统,也可以作为您现有交易系统的补充。 该指标分析当前蜡烛,计算蜡烛本身内部的某些强度因素,以及前一根蜡烛的参数。 因此,该指标预测市场走势的进一步方向和当前蜡烛的收盘价。 由于这种方法,该指标既适用于短期盘中交易,也适用于中长期交易。 该指标允许您设置指标在分析市场情况期间将产生的潜在信号的数量。 在指标设置中有一个特殊的参数。 此外,该指标可以通过图表上的消息、电子邮件以及推送通知的形式通知新信号。感谢您的关注!交易愉快! 购买后一定要写信给我! 我会给你我的交易指标的建议! 还可以获得奖金!
XauUsd Net Strength
Pieter Gerhardus Van Zyl
The XauUsd Net Strength indicator is a professional-grade market strength tool designed to track and compare the relative performance of Gold (XAU) against the U.S. Dollar (USD) across a diversified basket of currency pairs. Instead of relying on a single chart, it aggregates information from multiple gold- and dollar-based pairs, applies weighting factors, and translates the results into an easy-to-read strength comparison. The indicator plots six components in a separate window: Green & Red Hi
Trade informant
VLADISLAV AKINDINOV
The indicator is designed to display information about current trading. The current information and statistics panel displays data on the number of trading orders, their profit and the number of lots. The equity status as a percentage of the balance of funds and the total profit of all orders on this instrument are also displayed. In the statistics panel, you can see information on closed orders from the beginning of the specified date in the settings. The panels have flexible settings for size
Noize Absorption Index MT4
Ekaterina Saltykova
5 (1)
Noize Absorption Index - is the manual trading system that measures the difference of pressure between bears forces and bulls forces. Green line - is a noize free index that showing curent situation. Zero value of index shows totally choppy/flat market.Values above zero level shows how powerfull bullish wave is and values below zero measures bearish forces.Up arrow appears on bearish market when it's ready to reverse, dn arrow appears on weak bullish market, as a result of reverse expectation. S
Portfolio X Ray Pro
Alexandru Craciun
Portfolio X-Ray Pro: Stop Trading Blind. See Your True Risk. Do you know exactly how much exposure you have on USD right now? Or Gold? If you have 10 different trades open, calculating your total risk per symbol is a nightmare. A mental mistake here can blow an account. Portfolio X-Ray Pro solves this instantly. It aggregates every single open order, sorts them by volume, and presents your true net exposure in a stunning, professional dashboard that now collapses into a sleek, minimalist arro
Infinity Trend Pro
Yaroslav Varankin
1 (1)
This is a trend indicator without redrawing Developed instead of the binary options strategy (by the color of the Martingale candlestick) Also works well in forex trading When to open trades (binary options) A signal will appear in the place with a candle signaling the current candle It is recommended to open a deal for one candle of the current timeframe M1 and M5 When a blue dot appears, open a deal up When a red dot appears, open a trade down. How to open trades on Forex. When a signal is rec
介绍 Double Top and Bottom Multicurrency Scanner MT4,这是一款为希望识别多个货币对关键反转模式的交易者设计的创新指标。这个工具非常适合希望提升技术分析和决策过程的新手和经验丰富的交易者。 凭借其高效扫描双顶和双底模式的能力,这个指标通过提供及时的信号和警报,赋予交易者显著的交易优势,使他们能够利用潜在的市场反转,并优化进出场点。 MQL产品安装指南 | 在 MT4/MT5 上更新已购买的MQL产品 | 常见故障排除指南 | 指标设置 / 指南 主要特点 缓冲区集成:将指标值暴露为可访问的缓冲区,使 Expert Advisor 能够使用信号进行自动交易。 视觉箭头信号:在信号蜡烛上直接在图表上显示清晰的买入/卖出箭头,便于视觉阅读。 快速且可回测:基于 MetaTrader 的本地 OnCalculate() 引擎构建,确保快速计算并与策略测试器完全兼容,以进行历史回测。 弹出警报:在信号事件上触发 MetaTrader 警报弹出窗口,让您不会错过任何交易设置。 推送通知:实时向您的 MetaTrader 移动应用发送推送通知,以便随时监
Trade Assistant Pro 36 in 1
Makarii Gubaydullin
4.76 (21)
多功能交易工具:手数计算器、网格订单、风险回报比、交易管理、供需区、价格行为分析等 演示版   |   用户手册 交易助手 不能在策略测试器中运行:您可以下载 演示版 来测试此 实用工具 。 如有任何问题 /改进想法/发现错误 ,请 联系我 如需MT5版本,请点击 此处 简化、加速并自动化您的交易 流程 。通过此 仪表板 扩展标准终端功能。 交易面板 适用于任何交易品种:外汇、股票、指数、加密货币等。 1. 开立新交易 :手数/风险/风险回报比计算:手动交易的风险管理 手数计算器(基于风险规模计算交易量) 风险计算器(基于手数计算风险金额) 风险回报比 网格订单: + 动态间距选项和分割手数选项 订单激活触发器,+ 买入止损限价/卖出止损限价:MT4也可用 虚拟止损,虚拟止盈(隐藏止损,隐藏止盈:经纪商不可见) 智能止损/入场价位:如果K线收盘价超越此价位(避免错误触发) 隐藏订单(虚拟订单) 计划订单:即使市场休市也可下单(周末计划器) 附加多级止盈(多重获利了结) OCO订单(一单取消另一单),具有不同ID 交易可视化 + 图表上调整 以买入价(Bid)设置的止损/入场价位:避
该产品的买家也购买
Genesis Matrix Pro is a professional multi-timeframe trend detection indicator designed to help traders identify high-quality market alignment with clarity and structure. It combines 12 different technical indicators into one visual alignment matrix, allowing traders to quickly see when market conditions are bullish, bearish, or neutral. A signal is generated only when the selected strategies are aligned, helping reduce noise and improve decision-making. PLEASE CONTACT ME AFTER PURCHASE TO GET
Gann Made Easy
Oleg Rodin
4.83 (163)
Gann Made Easy 是一个专业且易于使用的外汇交易系统,它基于使用先生理论的最佳交易原则。 W.D.江恩。该指标提供准确的买入和卖出信号,包括止损和获利水平。您甚至可以使用推送通知在旅途中进行交易。 购买后请联系我,即可免费获得交易指导和超棒的额外指标! 您可能已经多次听说过江恩交易方法。通常 Gann 的理论不仅对于新手交易者而且对于那些已经有一定交易经验的人来说都是非常复杂的东西。这是因为江恩的交易方法在理论上并不那么容易应用。我花了几年时间来完善这些知识,并将最好的原则应用到我的外汇指标中。 该指标非常易于应用。您所需要的只是将其附加到您的图表并遵循简单的交易建议。该指标不断进行市场分析工作并寻找交易机会。当它检测到一个好的入口点时,它会为您提供一个箭头信号。该指标还显示止损和获利水平。 换句话说,当您像先生一样进行交易时,该指标会为您提供最佳江恩建议。江恩亲自告诉你此时此刻该做什么。但最好的部分是您不需要了解任何有关江恩交易原则的知识,因为该指标会为您完成整个市场分析工作。
The Propfolio Master Suite is the ultimate all-in-one analytical workstation for professional traders. Combining the power of the Beat The Market Maker (BTMM) methodology, Smart Money Concepts (SND/Liquidity), and Advanced Volume Profile, this suite replaces multiple different indicators with one optimized engine. Monitor up to 14 pairs simultaneously from a single chart, instantly identify market cycles, and seamlessly map institutional footprints with the click of a button. The Command Center
Scalper Inside PRO
Alexey Minkov
4.74 (69)
Scalper Inside PRO Scalper Inside PRO 是一款适用于 MetaTrader 4 的日内趋势与剥头皮指标,使用专有算法快速识别市场方向和关键目标价位。它能够自动计算进场价、出场价以及多级止盈目标,并显示详细的绩效统计,让您了解不同交易品种和策略以往的表现情况,从而帮助您为当前的市场环境选择最合适的交易工具。此外,您还可以将自己的箭头指标轻松接入 Scalper Inside PRO,快速评估其统计数据和历史表现。 该指标可用于任何交易品种和任何周期(建议在 M5 上进行日内交易),并内置多种交易策略,因此既可以作为独立的剥头皮工具使用,也可以作为您交易系统中功能强大的分析组件。 主要功能 通过专有算法(Next‑Generation Trend Detection Algorithm,NG TDA)快速识别当前市场趋势。 自动计算日内交易的进场价、出场价和多级止盈目标。 内置策略与统计模块,用于评估不同市场环境下各品种的表现。 支持接入自定义箭头指标(PRO 模式),并计算其详细信号统计数据。 适用于外汇、金属、指数、股票、商品、期货和加密货币等各类市
M1 Sniper
Oleg Rodin
5 (23)
M1 SNIPER 是一款易于使用的交易指标系统。它是一个专为 M1 时间框架设计的箭头指标。该指标可以作为独立的系统在 M1 时间框架下进行剥头皮交易,也可以作为您现有交易系统的一部分使用。虽然该交易系统专为 M1 时间框架交易而设计,但它也可以用于其他时间框架。我最初设计此方法是为了交易 XAUUSD 和 BTCUSD。但我发现这种方法在其他市场交易中也同样有用。 指标信号既可以顺势交易,也可以逆势交易。我教授一种特殊的交易技巧,帮助您利用指标信号进行双向交易。该方法基于使用特殊的动态支撑位和阻力位区域。 购买后,您可以立即下载 M1 SNIPER 箭头指标。此外,我还为所有 M1 SNIPER 工具用户免费提供下方屏幕截图所示的 Apollo Dynamic SR 指标!这两个指标的组合可以帮助您更轻松、更准确地利用 M1 时间框架进行交易。 购买后请联系我,免费获取交易提示和奖励指标! 祝您交易成功!
PRO Renko System
Oleg Rodin
5 (30)
PRO Renko Arrow Based System for trading renko charts.  准确的信号交易任何外汇工具. 另外,我将免费提供系统的附加模块! PRO Renko系统是RENKO图表上高度准确的交易系统。该系统是通用的。 该交易系统可应用于各种交易工具。 该系统有效地中和了所谓的市场噪音,打开了获得准确反转信号的通道。 该指标易于使用,只有一个参数负责产生信号。 您可以很容易地使算法适应您感兴趣的交易工具和renko酒吧的大小。 我很乐意通过提供任何咨询支持来帮助所有客户有效地使用该指标。 祝您交易成功!购买后,立即写信给我! 我将与您分享我的建议和我的renko发电机。 另外,我将免费提供系统的附加模块!
Auto Optimized Parabolic RSI: 高级 3D 动量引擎 大多数零售指标之所以失效,是因为它们依赖于静态输入,一旦市场波动率发生变化,这些输入就会崩溃。Auto Optimized Parabolic RSI 通过不断重新计算自身的数学优势,解决了“指标衰退”的问题,将机构级别的量化自适应能力直接引入您的 MT5 终端。 核心优势:定制的内存 3D 优化   标准的自动优化器通常会导致 MT5 平台卡顿,因为它们通过标准的指标调用使终端超载。该工具完全绕过了这些性能瓶颈。内部引擎采用定制的原生基于 RAM 的计算器构建,每次加载图表或更改时间周期时,它都会执行极速的 3D 网格搜索。它同时扫描 RSI 周期(频率)、SAR 步长(加速度)和 SAR 最大值(速度限制),在绝对的毫秒级时间内测试数以万计的参数组合,且完全不会拖慢您的平台。它不是仅仅寻找一个“不错”的设置,而是映射整个参数空间,以寻找资产当前动量结构的绝对全局最大值。 严格的财务评分与逼真的交易模拟   与基于抽象“指标点数”进行优化评分的业余工具不同,该引擎的 3.10 版本严格与资金数学挂钩。每
NAM Order Blocks
NAM TECH GROUP, CORP.
3.67 (3)
MT4多時限訂單塊檢測指示器。 特徵 -在圖表控制面板上完全可自定義,提供完整的交互。 -隨時隨地隱藏和顯示控制面板。 -在多個時間範圍內檢測OB。 -選擇要顯示的OB數量。 -不同的OB用戶界面。 -OB上的不同過濾器。 -OB接近警報。 -ADR高低線。 -通知服務(屏幕警報|推送通知)。 概括 訂單塊是一種市場行為,它指示從金融機構和銀行收取訂單。著名的金融機構和中央銀行帶動了外匯市場。因此,交易者必須知道他們在市場上正在做什麼。當市場建立訂單塊時,它會像發生大多數投資決策的範圍一樣移動。 訂單建立完成後,市場將朝著上升和縮小的方向發展。訂單大宗交易策略的關鍵術語是它包括機構交易者正在做的事情。由於它們是主要的價格驅動因素,因此包括機構交易在內的任何策略都可以。 您將在任何時間範圍內實時看到訂單塊,使用我們的控制面板,您將能夠在所選的歷史記錄週期內檢測常規,拒收和未大寫的訂單塊。 現在您可以接收到訂單塊接近警報,我們在MT4上顯示屏幕通知,並將通知推送到您的手機!
Smart Price Action Concepts
Issam Kassas
4.77 (13)
首先,值得强调的是,这个交易工具是非重绘、非重画和非滞后的指标,非常适合专业交易。 在线课程,用户手册和演示。 智能价格行动概念指标是一个非常强大的工具,既适用于新手,也适用于经验丰富的交易者。它将超过20个有用的指标合并到一个指标中,结合了高级交易思想,如内圈交易员分析和智能资金概念交易策略。该指标侧重于智能资金概念,提供有关大型机构交易方式的见解,帮助预测它们的动向。 它在流动性分析方面尤其擅长,有助于理解机构的交易方式。它擅长预测市场趋势,并仔细分析价格波动。通过将您的交易与机构策略对齐,您可以更准确地预测市场走向。该指标多才多艺,擅长分析市场结构,识别重要的订单区块,并识别各种模式。 它擅长识别BOS和CHoCH等模式,理解动量的转变,并突出显示供需强劲的关键区域。它还擅长发现强大的不平衡,并分析价格创造更高高点或更低低点的模式。如果您使用斐波那契回撤工具,该指标可以满足您的需求。它还可以识别相等的高点和低点,分析不同的时间框架,并通过仪表板显示数据。 对于使用更高级策略的交易者,该指标提供了工具,如公平价值差指标和优惠和折扣区域的识别。它特别关注高时间框架订单区块,并
Quants HL Break
Ferhat Mutlu
5 (2)
通過純價格行為進行高級計算,以找到 LH 和 HL 突破。 它會給你一個很好的市場反轉點。 LH 和 HL 信號也可用於 traingle 突破。 一旦突破發生,則表明強烈反轉。 移動平均線的漂亮過濾器。 我強烈建議將其與趨勢指標一起使用。 可用作支撐和阻力、供需指標的額外確認。 可以在以下外匯線程中找到更多詳細信息: 該指標未重新繪製。 Buffers :   SetIndexBuffer ( 0 ,UpBar);      SetIndexBuffer ( 1 ,UpBar2);           SetIndexBuffer ( 2 ,DnBar);      SetIndexBuffer ( 3 ,DnBar2);           SetIndexBuffer ( 4 ,UpBarTop);      SetIndexBuffer ( 5 ,UpBarLow);                    SetIndexBuffer ( 6 ,DnBarTop);      SetIndexBuffer ( 7 ,DnBarLow);           SetIn
Dynamic Forex28 Navigator
Bernhard Schweigert
4.43 (7)
Dynamic Forex28 Navigator - 下一代外汇交易工具。 当前 49% 折扣。 Dynamic Forex28 Navigator 是我们长期流行的指标的演变,将三种功能合二为一: 高级货币强度 28 指标 (695 条评论)+ 高级货币 IMPULSE 带警报 (520 条评论)+ CS28 组合信号(奖励)。 有关指标的详细信息 https://www.mql5.com/en/blogs/post/758844 下一代强度指标提供什么? 您喜欢的原始指标的一切,现在通过新功能和更高的精度进行了增强。 主要特点: 专有货币强度公式。  所有时间范围内的平滑和准确的强度线。 非常适合识别趋势和精确进入。 动态市场斐波那契水平(市场斐波那契)。  此指标独有的独特功能。 斐波那契应用于货币强度,而不是价格图表。 适应实时市场活动以获得准确的反转区域。 实时市场动量。  第 9 行显示市场是活跃还是被动。 对于定时交易至关重要。 全面的警报和显示。  每种货币最强的买入和卖出动量。 ​​28 对的双重动量买入和卖出。 超买/超卖警告外部范围和止损。 反转
PZ Harmonacci Patterns
PZ TRADING SLU
3.17 (6)
可以说,这是您可以为MetaTrader平台找到的最完整的谐波价格形成自动识别指标。它检测19种不同的模式,像您一样认真对待斐波那契投影,显示潜在的反转区域(PRZ),并找到合适的止损和获利水平。 [ 安装指南 | 更新指南 | 故障排除 | 常见问题 | 所有产品 ] 它检测19种不同的谐波价格形态 它绘制了主要,衍生和互补的斐波那契投影(PRZ) 它评估过去的价格走势并显示每个过去的形态 该指标分析其自身的质量和性能 它显示合适的止损和获利水平 它使用突破来表明合适的交易 它在图表上绘制所有样式比率 它实现了电子邮件/声音/视觉警报 受斯科特·M·卡尼(Scott M. Carney)的书的启发,该指标旨在满足最纯粹和最熟练的交易者的需求。但是,它采取了一种使交易更容易的方式:在向交易发出信号之前,它会等待Donchian朝正确方向突破,从而使交易信号非常可靠。 斐波那契投影与向量无关 它实现了电子邮件/声音/推送警报 它绘制了ABCD投影 重要提示: 为了符合 Scott M. Carney先生 的商标申诉,某些图案名称已重命名为不言自明的替代方式, Scott M.
RFI levels PRO
Roman Podpora
5 (1)
该指标能够准确显示反转点和价格回落区域。     行业领军人物 。您能洞察新趋势的形成,并以最高的精准度做出决策,掌控每一笔交易。 与……结合时,展现其最大潜力     趋势线专业版   指标  VERSION MT5 该指标显示的内容: 新趋势开始时的反转结构和反转水平及其激活。 显示屏   获利了结   和   止损   风险回报比最低的水平     RR 1:2       。 具有智能减值逻辑的止损。 显示指定指标中两种趋势类型的反转形态。 指标: 根据     趋势线     (全球趋势变化) 潮流专业版     (趋势快速变化) 简单有效   扫描器   实时趋势(新增)。 多时间框架工具筛选。 展示   利润   在 LOGIC AI 信号之后。 以下列出今日走势积极的金融工具。(RB键) 能够为终端启用通知(警报)功能,并向移动设备推送通知。 逻辑人工智能     — 利用人工智能寻找最佳切入点。 只有在启用 MTF(多时间框架分析)模式时,该功能才可用。 兼容性。 当与趋势线指标结合使用时,该指标能发挥其最大潜力。 这     RFI LEVELS PRO    
Trend Catcher ind
Ramil Minniakhmetov
趨勢捕捉指標 趨勢捕捉指標結合了作者獨有的客製化自適應趨勢分析指標,用於分析市場價格趨勢。它透過過濾掉短期噪音,並專注於潛在的動能強度、波動性擴張和價格結構行為,來識別真實的市場方向。此外,它還結合了平滑和趨勢過濾等客製化指標,例如移動平均線、相對強弱指標 (RSI) 和波動率過濾器。 您可以在這裡查看實際運行情況以及我的其他產品: https://www.mql5.com/en/users/mechanic/seller 請注意,我不會在 Telegram 上出售 EA 或任何設置,那是騙局。所有設定都可以在我的部落格上免費取得。 重要提示!購買後請立即聯繫我,以獲取使用說明和額外獎勵! 請注意,我不會在 Telegram 上出售 EA 或任何設置,那是騙局。所有設定都可以在我的部落格上免費取得。
Apollo SR Master
Oleg Rodin
5 (2)
Apollo SR Master 是一款支撑/阻力指标,其特殊功能使利用支撑/阻力区域进行交易更加便捷可靠。该指标通过检测局部价格顶部和底部,实时计算支撑/阻力区域,没有任何时间延迟。为了确认新形成的支撑/阻力区域,该指标会显示特殊信号,表明该支撑/阻力区域可以作为实际的卖出或买入信号。在这种情况下,支撑/阻力区域的强度会增强,因此从该区域进行交易的成功率也会更高。这正是该指标的核心理念。 SR区域也使止损和止盈的操作更加便捷。根据信号方向,可以将SR区域上方或下方的空间用作止损位。此外,相对的SR区域也可以用作潜在的止盈区域。 我还免费向所有 Apollo SR Master 指标的用户提供我的“Apollo 价格行为系统”指标。这两个指标结合使用将帮助您找到更好的入场点。 购买后请联系我,即可免费获得我的交易技巧以及我的“阿波罗价格行为系统”指标作为赠品!
Grabber System
Ihor Otkydach
5 (2)
向您介绍一款优秀的技术指标——Grabber,它是一套即开即用的“全包式”交易策略。 在一个代码中集成了强大的市场技术分析工具、交易信号(箭头)、提醒功能和推送通知。 每位购买该指标的用户还可免费获得以下内容: Grabber辅助工具:用于自动管理已开仓位 视频操作指南:逐步教学如何安装、设置和使用该指标进行交易 原创Set文件:可快速自动配置,帮助实现最佳交易效果 忘掉其他策略吧!只有Grabber能够真正激励你在交易中攀登新高峰! Grabber策略的主要特点: 交易周期:从M5到H4 适用资产:任意,但我推荐我亲自测试过的品种(GBPUSD、GBPCAD、GBPCHF、AUDCAD、AUDUSD、AUDSGD、AUDCHF、NZDUSD、NZDCAD、EURCAD、EURUSD、EURAUD、EURGBP、EURCHF、USDCAD、USDSGD) 交易时间:全天候 24/7 交易类型:波段交易(反转系统)
Advanced Supply Demand
Bernhard Schweigert
4.91 (300)
现在优惠 40%! 任何新手或专业交易者的最佳解决方案! 该指标是一款独特、高质量、且价格合理的交易工具,因为我们已经整合了许多专有功能和新公式。 依据此更新,您将能够显示双重时间帧区域。 您不仅可以显示一个较高的时间帧,还可以同时显示图表时间帧,加上更高的时间帧:显示嵌套时区。 供需双方所有交易者都会喜欢它。 :) 重要信息披露 高级供需的最大潜力,请访问 https://www.mql5.com/zh/blogs/post/720245   想象您的交易如何得以改善,是因为您能够精准定位入场或目标位吗? 构建于新的底层算法,它可以更轻松地识别出买卖双方之间的潜在失衡。 这是因为它以图形方式展示供需最强劲区域,及其过去的表现(显示旧区域)。 这些功能旨在帮助您更轻松地发现最佳入场区域和价位。 现在您可以针对您的交易品种和时间帧来优化和编辑区域强度! 高级供需指标适用于所有产品和时间帧。 它是一个新的公式,非常新的功能是两个区域强度函数可由用户输入进行调整! 这在交易中是一大优势。 当您学习如何使用专有功能,例如带有价格游离最小 X 因子的区域强度时,您能够判断该区域强劲与否。 供需
GoldRush Trend Arrow Signal
Kirk Lee Holloway
5 (2)
GoldRush 趨勢箭頭信號 GoldRush 趨勢箭頭信號 指標為 XAU/USD 中的高速、短期短線交易者提供精確、實時的趨勢分析。 專為1分鐘時間框架設計,此工具顯示方向箭頭以明確顯示入場點,使短線交易者能在波動市場中自信操作。 該指標包含主要和次要警示箭頭。主要信號為白色和黑色方向箭頭,用於指示趨勢方向的轉變;次要信號為藍色和紅色箭頭,用於確認主要箭頭指示的方向並提示潛在交易入場點。 注意:當趨勢方向發生變化後僅出現一個主要警報箭頭時,請注意可能會出現多個次要藍/紅箭頭。次要信號將在滿足信號標準的任何蠟燭圖後出現,因此在長期趨勢移動中,螢幕上將顯示大量次要箭頭(如附帶的截圖所示)。您可在設置中開啟或關閉任一箭頭類型。 以下是我使用此指標進行交易的方式: - 對於買入入場,我會耐心等待白箭頭在蠟燭收盤時出現,並在下一根可用蠟燭收盤時出現藍箭頭時進行買入交易。 - 對於賣出入場,我會耐心等待黑箭頭在蠟燭收盤時出現,並在下一根可用蠟燭收盤時出現紅箭頭時進行賣出交易。 - 獲利了結/止損設置由使用者自行負責,但我個人使用最低R:R為1:2,並發現這在倫敦/紐約開盤等
Introduction to Fractal Pattern Scanner Fractal Indicator refers to the technical indicator that makes use of the fractal geometry found in the financial market. Fractal Pattern Scanner is the advanced Fractal Indicator that brings the latest trading technology after the extensive research and development work in the fractal geometry in the financial market. The most important feature in Fractal Pattern Scanner is the ability to measure the turning point probability as well as the trend probabi
Advanced Currency Strength28 Indicator
Bernhard Schweigert
4.91 (657)
目前40%的折扣 任何新手或专家交易者的最佳解决方案! 这个指标是一个独特的、高质量的、可负担得起的交易工具,因为我们纳入了一些专有的功能和一个新的公式。只需一个图表,你就可以读出28个外汇对的货币强度!想象一下,你的交易将如何得到改善,因为你的交易是在你的手中进行的。想象一下,你的交易将如何改善,因为你能够准确地确定新趋势或剥头皮机会的触发点? 用户手册:点击这里  https://www.mql5.com/en/blogs/post/697384 这是第一本,原版的! 不要买一个毫无价值的崇拜者的克隆品。 特别的 子窗口中的箭头显示强劲的货币势头GAP将指导你的交易! 当基础货币或报价货币处于超卖/超买区域(外盘斐波那契水平)时,在个人图表的主窗口中出现警告信号。 当货币力量从外围区间回落时,回撤/反转警报。 十字星模式的特别警报 可选择多个时间框架,以快速查看趋势! 货币强度线在所有的时间框架中都非常平稳,当使用较高的时间框架来识别总体趋势,然后使用较短的时间框架来确定精确的入口时,效果非常好。你可以根据自己的意愿选择任何时间框架。每个时间框架都由其自身进行了优化。
Cycle Sniper
Elmira Memish
4.39 (36)
Please contact us after your purchase and we will send you the complimentary indicators to complete the system Cycle Sniper is not a holy grail but when you use it in a system which is explained in the videos, you will feel the difference. If you are not willing to focus on the charts designed with Cycle Sniper and other free tools we provide, we recommend not buying this indicator. We recommend watching the videos about the indiactor and system before purchasing. Videos, settings  and descri
Market Structure Patterns MT4
Samuel Manoel De Souza
5 (18)
Market Structure Patterns   is an indicator based on   smart money concepts   that displays   SMC/ICT   elements that can take your trading decisions to the next level. Take advantage of the   alerts ,   push notifications   and   email messages   to keep informed from when an element is formed on the chart, the price crosses a level and/or enters in a box/zone. Developers can access the values of the elements of the indicator using the   global variables  what allows the automation of trading d
Advanced UT BOT ALERTS for MT4 專業多重濾波趨勢識別系統|強化版 UT BOT 引擎 我們只提供高品質的指標。 Advanced UT BOT 為專業交易者設計,採用穩定的信號邏輯與安全運算結構,確保無延遲與錯誤更新。 它 不會重繪、不會重畫、不會刪除或修改 任何過去的信號。 所有 BUY 和 SELL 信號均在 K 線收盤後生成並固定 ,確保穩定性與準確性。 在即時行情中 不會重繪 ,信號會在收盤後即時出現。 限時優惠中 —— 下一次價格將調整為 49 美元。 請把握現在的優惠價格,售完即漲。 產品概述 Advanced UT BOT ALERTS   是新一代的趨勢信號系統,基於   UT BOT   的核心邏輯重新打造, 全面升級為 MT5 版本,融合多重濾波、動態視覺化與高精度警報系統。 UT Bot 指標最初由   Yo_adriiiiaan   開發,本版本由   PioneerAlgoFX   團隊深度強化, 在穩定性、精準度與自訂性方面均達到專業級水準,為實戰交易者而設計。 此系統能夠高精準地識別趨勢反轉與動能變化, 透過多層動態濾波與
购买后请联系我,获取基于此指标的奖励EA。 Self Optimizing Double MA Strategy 是一款专业级别的交易工具,旨在消除参数猜测。它由内置的自动优化引擎驱动,通过在后台模拟数千种参数组合,不断适应不断变化的市场条件,从而保持统计上的优势。 该指标不依赖于静态、过时的设置,而是动态更新其内部逻辑,为当前的时间周期和交易品种寻找最赚钱的配置。 核心功能 内置自动优化:系统会根据您选择的更新频率,定期重新计算快速 MA、慢速 MA 和 RSI 的周期,确保您的设置始终与当前的市场节奏保持一致。 MA 发散过滤器:一项核心的趋势强度指标,仅在移动平均线积极发散时才确认信号的有效性。这可以防止在均线收敛或平缓的盘整市场中产生虚假的入场信号。 时序评分引擎:内部模拟器在图表上绘制任何实时信号之前,会根据您的具体目标(例如最大化利润因子或最小化回撤)对历史信号进行评估。 动态 ATR 区域:根据实时市场波动率,自动计算并在图表上直观地投射出止盈和止损区域。 实时绩效仪表板:直接在您的图表上跟踪并显示实时的系统指标,包括历史胜率、平均回撤以及产生的总点数。 完美支持 EA
Day Trader Master
Oleg Rodin
5 (15)
Day Trader Master 是一个完整的日间交易者交易系统。该系统由两个指标组成。一个指标是买入和卖出的箭头信号。这是你得到的箭头指示器。我将免费为您提供第二个指标。第二个指标是专门设计用于与这些箭头结合使用的趋势指标。 指标不重复也不迟到! 使用这个系统非常简单。您只需按照当前趋势方向的箭头信号,显示为双色线。蓝色是买入趋势。红色是一种销售趋势。蓝色箭头是买入信号。红色箭头是卖出信号。您需要箭头的颜色和信号的方向来匹配趋势线的颜色。 箭头指标主要是为 M5 和 M15 时间间隔的日内交易而创建的。但从技术上讲,该系统可以用于其他时间间隔。 指示器配备带有推送消息功能的弹出警报。 购买后一定要写信给我!我将为您提供与系统交易的个人建议,以及我的趋势指标。此外,还有丰厚的奖励等着您!
Candle Power Pro
Thushara Dissanayake
4.5 (8)
这   蜡烛电源专业版   是一款旨在解码的复杂交易工具   实际成交量压力、报价数据不平衡以及机构订单流动态   通过测量   牛市蜱虫与熊市蜱虫之间的斗争   实时。该指标将原始   成交量数据转化为可操作的见解 ,帮助交易者识别   智能货币运动、流动性追逐和隐藏的市场心理   在每个价格 K 线图背后。通过分析   买方/卖方成交量百分比、分歧模式和基于成交量的确认 ,它弥补了   价格行为和交易量分析 ,对于关注以下交易者来说非常有价值     ICT、SMC 和机构交易方法 。 与传统的成交量指标不同,     蜡烛电源专业版   专注于   报价数据粒度 ,揭示每根蜡烛的走势是否与标的一致   牛市/熊市强度   或发出潜在信号   做市商陷阱、逆转或突破延续 。它与   基于时段的策略(伦敦/纽约杀戮地带)、公允价值缺口(FVG)和区间突破 ,提供对   市场流动性和参与者意图 。 工作原理: 指标流程   实时报价量数据 ,计算百分比   看涨交易与看跌交易   每根蜡烛内。这揭示了: 买家/卖家不平衡:     看跌蜡烛图上牛市跳动百分比较高,警告   潜在的逆
如果您进行外汇交易,了解货币强弱和货币对相关性等详细信息,可以让您的交易更上一层楼。通过相关性分析,您可以将风险减半,而强弱分析将帮助您最大化利润。 本指标通过结合货币强弱分析和货币对相关性,提供了一种混合的方法,帮助选择最合适的货币对进行交易。 如何使用货币强弱分析 假设您的交易策略在AUD/JPY上提供了买入机会,但通过KT货币强弱分析发现JPY比AUD更强。那么,这笔交易很可能以亏损告终。有了这个指标,您可以轻松避免此类亏损。 如何使用货币对相关性 假设您的交易策略同时在NZD/USD和GBP/JPY上提供了卖出机会。通过KT货币对相关性功能,您发现这两个货币对的相关性达到77%。  由于这些货币对高度相关,同时交易它们只会加倍您的风险。如果在NZD/USD上出现亏损,GBP/JPY上的交易也很有可能出现亏损。 功能特点 快速识别最强和最弱货币,用以验证交易策略生成的交易机会。 通过避免交易高度相关的货币对,将风险降低一半甚至三分之一。 当某个货币成为最强或最弱时,接收警报通知。 通过货币金字塔分析强弱报告,将货币按强到弱进行排序。 详细了解货币强弱分析 货币强弱分析通
CRT Candle Range Theory HTF MT4.   Ultimate CRT Indicator: Advanced ICT Concepts and Malaysian SnR Trading System Discounted   Price   $50  !!     Secure your lifetime access   now   before it switches to   subscription-only ! Master the Market Maker's Footprints with the Most Advanced Candle Range Theory Indicator Unlock the true power of   Smart Money Concepts (SMC)   and trade precisely like the institutions with the   Ultimate CRT Indicator . Built exclusively for serious traders, this indic
Route Lines Prices -  是一款用于寻找价格方向的指标。其简洁的界面包含多种价格行为和未来方向计算算法。这些算法包括基于所用时间周期的波动率计算和价格平滑。 该指标只有一个参数,用于更改“ Calculating price values ”。默认值 1 提供均衡的自动计算, 无需手动配置即可使用。 通过手动更改 2 到 500 之间的值,您可以根据自己的交易系统自定义指标。 建议在 M1 到 H4 的时间周期内使用此指标。适用于任何交易品种。 信号箭头在蜡烛图收盘时生成;不会重绘历史数据。 主图表上提供重复箭头。 提供多种类型的警报。内置的线轨迹计数器基于收盘价工作。这意味着,当出现相反信号时,会确定价格轨迹的数值,并在信号结束后的下一根蜡烛图上显示这些数值。 总计数器将获得的值相加,以便在相应的图表上方便地调整参数。
KURAMA GOLD SIGNAL PRO(MT4版)— 7层过滤器、自动TP/SL、品质评分搭载 XAUUSD完整交易系统 不重绘。不重画。不延迟。每个信号永久固定。所见即所得。 福利:购买买断版许可证可免费获得 AI Zone Radar(价值$59)+ 完整PDF手册。购买后请给我发消息。 AI Zone Radar: https://www.mql5.com/en/market/product/175834 交易员的信赖:已被活跃的黄金交易员社区使用。因精度和易用性获得赞誉。 你的问题 — 以及解决方案 你知道黄金每天波动$30-50。你知道这里有钱可赚。但是: - 入场过早,价格反向$10后才朝你的方向走 - 每次MA触碰都入场,结果一半都失败 - 没有TP/SL系统,所以持仓太久或离场太早 - 在死寂时段交易,然后想为什么什么都不顺 KURAMA GOLD SIGNAL PRO解决了这一切。不是用一个过滤器,而是七个。 工作原理 — 3步 1. 图表上出现箭头信号 2. 在面板上查看TP价格、SL价格、品质评分、风险回报比 3. 下单并等待 无
作者的更多信息
CoralDash
D Armond Lee Speers
CoralDash is a simple symbol shortcut dashboard.   The Symbol List has many presets to choose from:  Market Watch Open Orders Current Chart Majors A custom list Clicking the symbol has two available actions Set the current chart symbol Filter the list of symbols shown in the dashboard based on one currency (e.g., see all EUR pairs) Click the "PAIR" cell in the header to toggle between the two available actions Click the symbol cell to apply the action For the filter, click the left side to selec
FREE
CoralPage
D Armond Lee Speers
CoralPage is a simple little utility to add navigation controls to your chart.  You can now easily step through the symbols in the Market Watch without having to click-and-drag a symbol from the Market Watch onto your chart.  It's a simple but indispensable time-saver! Click move to the first, previous, next or last symbol in the Market Watch.  Shift-click to go the the previous or next symbol that has an open order. CoralPage is completely free.  If you like this, please check out my other prod
FREE
Coral Trade Planner
D Armond Lee Speers
Coral Trade Planner is a 3-in-1 tool for making smart trades.   The Lot Size Calculator lets you determine the appropriate lot size based on risk, and see the impact on your risk as you change the stop loss distance and/or lot size.   The Trade Planner is an innovative tool for visualizing your planned trades on the chart, and gives you immediate feedback on the value of the trade (both the risk of hitting your stop loss and the reward of hitting your take profit).  Both Market and Pending order
Coral Multi TF Meter
D Armond Lee Speers
Coral Multi TF Meter allows you to quickly see how price is moving on a single currency pair across multiple timeframes at once.  You can select which timeframes to display; the size, position, colors of cells; whether to display values or not; and how often the meter is updated. The calculation is based on ATR distance for each displayed timeframe.  Hover over the header cell for the row (with the currency name in it) to see the current ATR value (in pips) for that period.  When "Display Values
Coral Rate of Change Dashboard  displays "rate of change" calculations across multiple symbols and timeframes simultaneously.  See at a glance which pairs are moving, and how quickly.  Receive alerts when any symbol + timeframe is experiencing very strong movement.  You can display data for currency pairs, or for individual currencies (takes the average for each currency across all available pairs). See the CoralDash product description for the core functionality of the dashboard (symbol exposu
Coral Notify Dash
D Armond Lee Speers
Coral Notify Dash allows you to manage all of your chart price-based notifications from a single consolidated dashboard.  It fills a gap left by MT4, which does not support popup alerts.  If you're like me and you often don't hear the alert sound for the built-in alerts, this is an indispensable tool. I use Coral Notify Dash as part of my daily chart analysis workflow.  I use a tool like Coral Dash (available for free,  here ) or one of the other dashboards to set my trading bias.  As I review t
Coral History
D Armond Lee Speers
Coral History displays information about your trading account and a summary of your history for the day, week, month and all time in a convenient, lightweight window. NEW : You can now set daily / weekly / monthly goals.   Coral History can notify you when reaching a goal.  If set the goal will be displayed in the History section row header; and if you've reached the goal the row will be highlighted in green. Account Information Balance Equity Free Margin (amount, percent or drawdown) Marin Leve
Coral Rescue
D Armond Lee Speers
Coral Rescue will help save an account with trades in drawdown.  Do you have losing trades that are just too large to deal with?  They reduce your available margin and can be accumulating swap costs, but the loss would be too great to just accept closing the trades.  Just hoping that price will eventually come back is not an effective strategy, you need a disciplined, consistent and preferably automatic way to dig yourself out of the hole. Coral Rescue is not an EA that places trades on its own.
Chart Logic
D Armond Lee Speers
Chart Logic is here!  Chart automation for MT4: put your Ideas into Actions! Chart Logic is an EA for MT4 that lets you automate actions on your charts.  You define "conditions" and 'actions"; when all the conditions are true, then all the actions are triggered.  Conditions can refer to a wide range of observations, about account information, candle data, technical indicators, key levels, price, time, market data, trades and so on.  And actions can send alerts/notifications, open/close/modify tr
筛选:
无评论
回复评论