MA Cross Alerts
- 指标
- 版本: 1.0
- 激活: 5

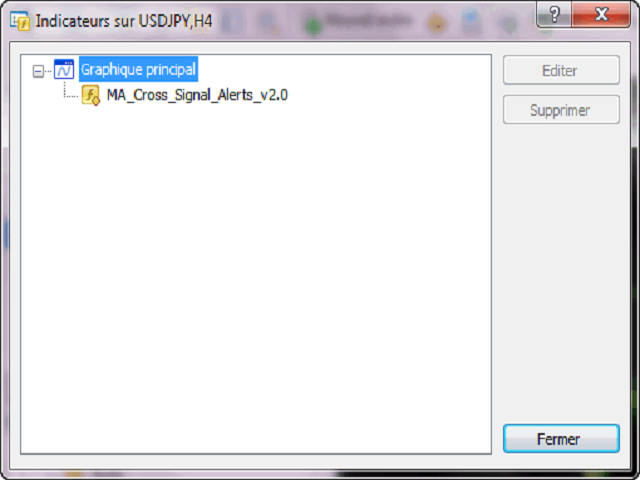
MA Cross Signal Alerts
MA Cross Signal Alerts_v2.0
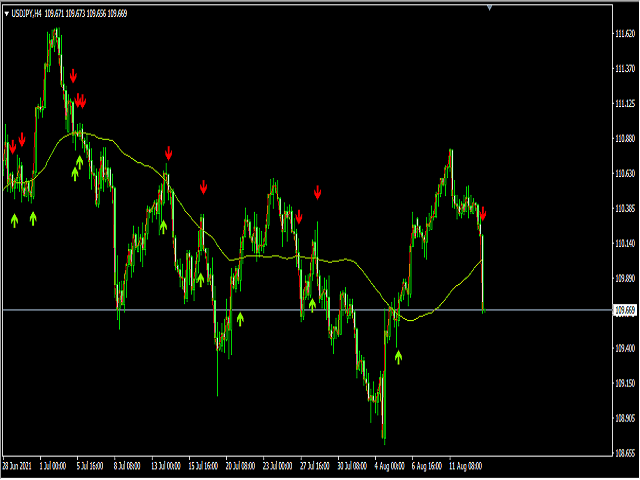
The Moving Average Cross displays a fast and a slow moving average (MA). A signal arrow is shown when the two MAs cross. An up arrow is displayed if the fast MA crosses above the slow MA and a down arrow is given if the fast MA crosses below the slow MA. The user may change the inputs (close), methods (EMA) and period lengths.
- When two Moving Averages cross the indicator will alert once per cross between crosses and mark the cross point with down or up arrow.
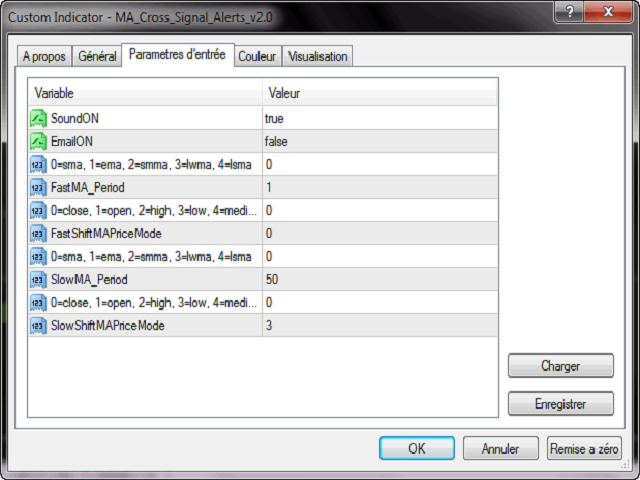
Alert Options
- SoundON
- EmailON
Which point they crossed over. It is more usful on the shorter
periods that get obscured by the bars / candlesticks and when
the zoom level is out. Also allows you then to remove the mas
from the chart. (emas are initially set at 5 and 20)